


US Dollar, EUR/USD, USD/JPY, USD/CAD Talking Points:
- Is the US Dollar about to go bearish again after a strong start to 2021 trade?
- Next week brings FOMC along with updated projections and forecasts: Bring the popcorn because we could be in for a good show from volatility.
- The analysis contained in article relies on price action and chart formations. To learn more about price action or chart patterns, check out our DailyFX Education section.
It was another surprising start to the month in the US Dollar, where buyers pushed the currency up to a fresh three-month-high earlier this week. But, after finding sellers at the 92.50 psychological level on Tuesday morning, USD bears have been on the way back, helping to push prices lower for the past three days, creating a ‘three black crows’ candlestick formation – which will often be approached with the aim of bearish continuation.
This begs the question – might we finally be on the cusp of that US Dollar breakdown that so many were looking for coming into this year? That includes myself, as I had shared in the Q1 Technical Forecast on the US Dollar. I was expecting a counter-trend rip that may last through the first quarter or perhaps even into the first-half of this year. This was driven by both massive oversold readings to go along with a falling wedge that had built from the Presidential Election into year-end. But, I kept the forecast for the US Dollar at bearish as I ultimately expected (and continue to) bears to take over the matter while driving down to fresh two-year-lows.

With FOMC on the economic calendar for next week – are US Dollar bears readying a return? This is a loaded meeting as we’ll also be getting updated forecasts, which we haven’t had since December and quite a bit has changed since then.
From the weekly chart below – we can see the point of resistance that helped to mark this week’s high -both a psychological level of 92.50 as well as the 23.6% Fibonacci retracement of the 2020 sell-off.
To learn more about Fibonacci, check out the Fibonacci sub-module inside of DailyFX Education
US Dollar Daily Price Chart

Chart prepared by James Stanley; USD, DXY on Tradingview
EUR/USD Runs Back to Resistance Post-ECB
The big driver so far today has been the European Central Bank rate decision. After an initial statement that said the bank would ‘significantly’ increase bond buys in the coming months, a muddled message around inflation expectations left many scratching their heads. This was somewhat apparent in the currency as well, as an initial sell-off quickly found support before prices ran right back into a key zone of resistance around the psychological level of 1.2000.
To learn more about psychological levels as support/resistance, join us in DailyFX Education
At this point, EUR/USD may be one of the few major pairs holding some attraction for long-USD themes. The pair is currently displaying a potential bear flag formation with prices at resistance. But, as noted above, USD-weakness could come back very quickly considering the FOMC event on the calendar for next week, so if the bear flag is nullified, the long side of the pair could become attractive again, with aim towards a revisit of the prior resistance zone running from 1.2133-1.2167.
To learn more about bear flag formations, check out DailyFX Education
EUR/USD Hourly Price Chart
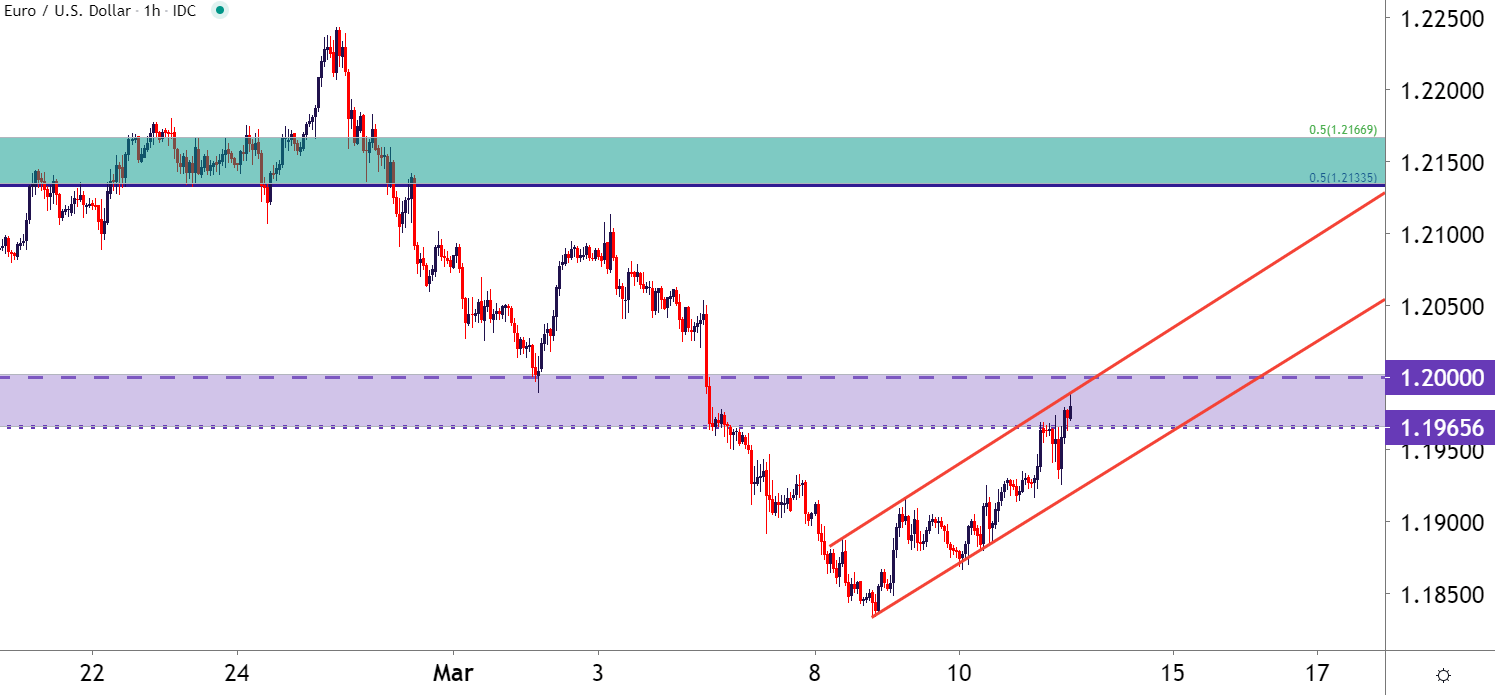
Chart prepared by James Stanley; EURUSD on Tradingview
USD/JPY: Did the Long-Term Trendline Help Dollar-Yen to Find a Top?
USD/JPY has been on a freight train of a bullish run so far in 2021, tracking along with the broader move in yields as the 10-year note has flown up to a high around 1.6% - both surprising moves.
But in USD/JPY, the pair ran into a significant long-term trendline this week and matters haven’t really been the same since. Below, the trendline in red connects swing highs from 2015 and 2020.
To learn about drawing and working with trendlines, check out DailyFX Education
USD/JPY Weekly Price Chart
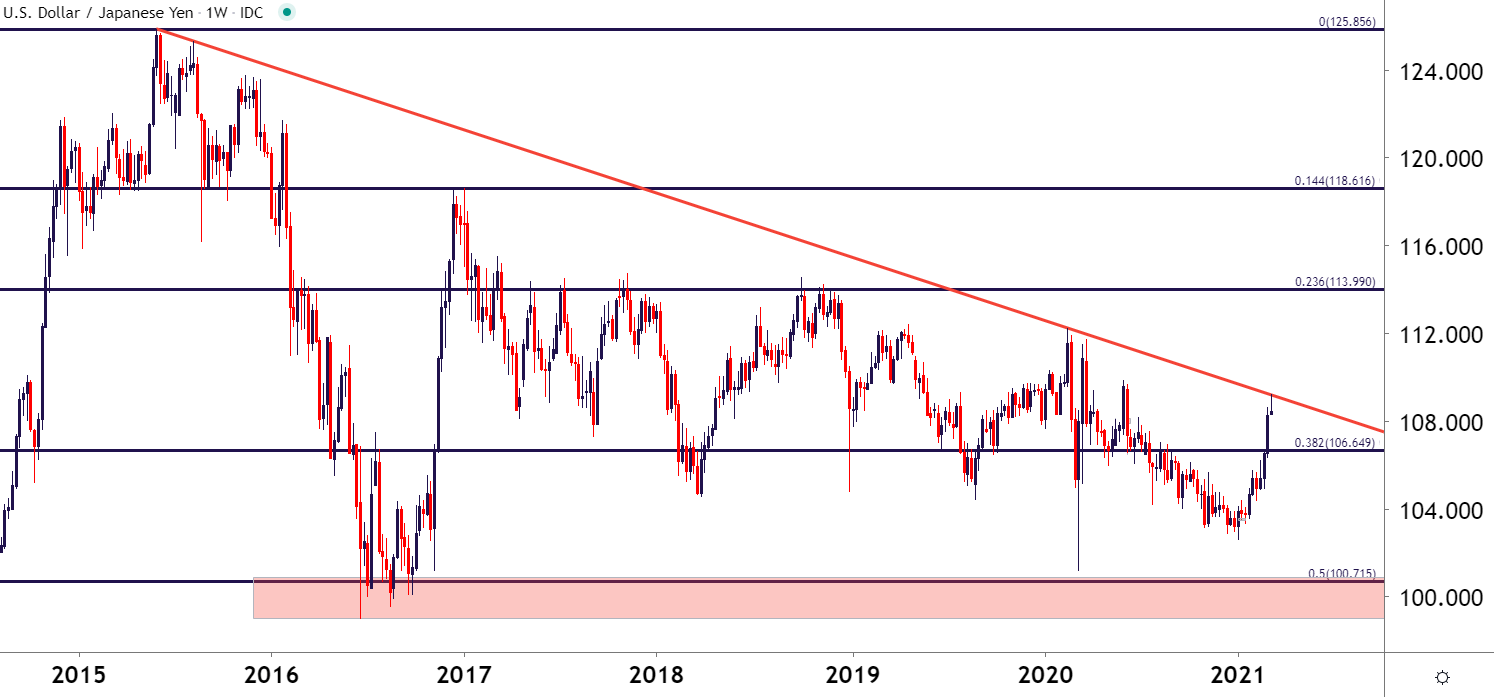
Chart prepared by James Stanley; USDJPY on Tradingview
Given recent trend dynamics and just how hard buyers have pushed – there could be current avenues to plot for continuation. Short-term price action is currently holding up around higher-low support, and this could keep the door open for another re-test of that high that was set on Monday above 109.00.
But – examination of shorter-term charts brings about bearish potential, as that horizontal support is coupled with a series of lower-highs after the trendline inflection, and this produces a descending triangle formation, often approached with the aim of breakdown potential. This combined with still overbought readings in RSI on the daily chart keep the door open for bearish potential.
To learn more about working with descending triangles or to learn more about the RSI indicator, join us in DailyFX Education
USD/JPY Two-Hour Price Chart
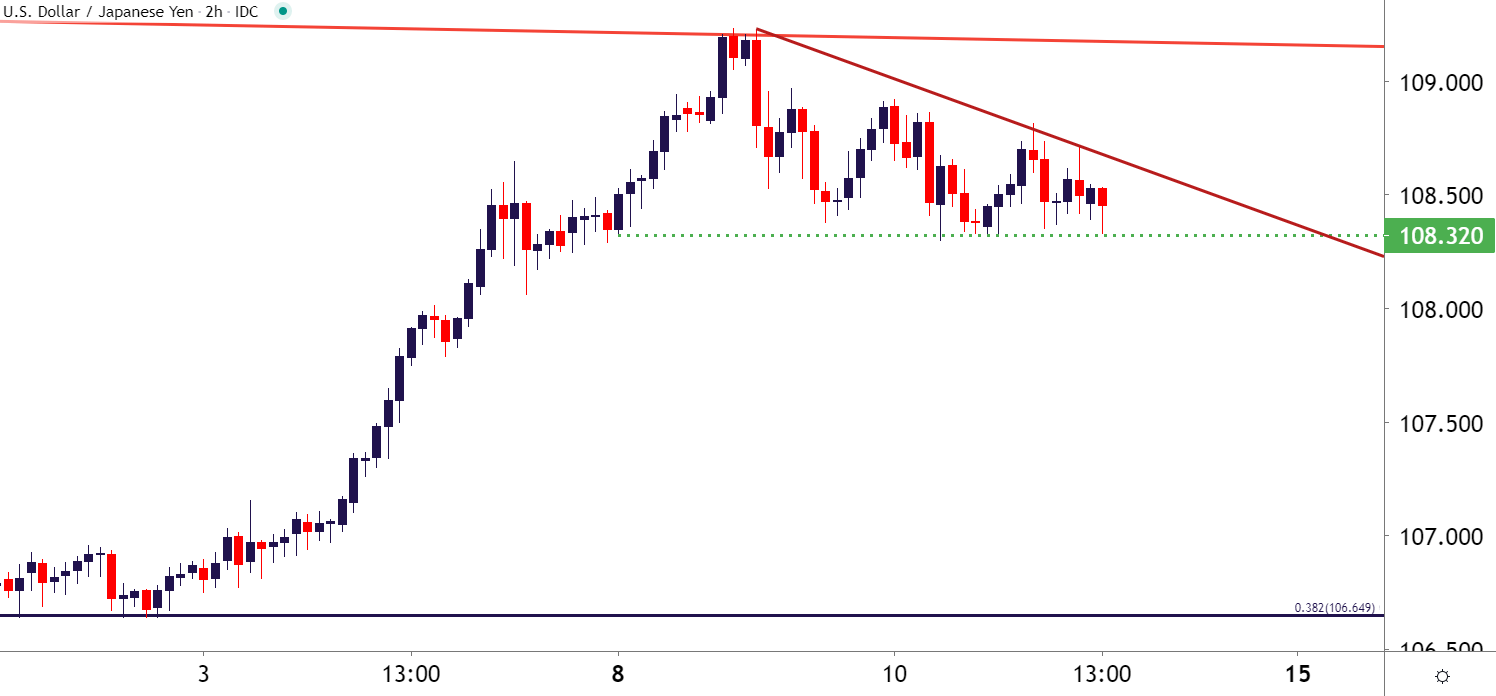
Chart prepared by James Stanley; USDJPY on Tradingview
USD/CAD Threatening Breakdown to Two-Year-Lows
USD/CAD caught a major reprieve in late-February after re-engaging with the 1.2500 psychological level. What was a hard bearish trend quickly turned, and as US Dollar strength and higher Treasury yields drove the first week of March, the pair pulled away from the big fig.
But sellers have come back with a vengeance here – and if we are on the cusp of another round of US Dollar weakness, the short-side of this pair could be very attractive given the commodity exposure of the Canadian Dollar. This is a big item to watch around the FOMC for next week: If USD strength does come about, the two pairs looked at above would likely be more attractive than what may show in USD/CAD. Meanwhile, if USD-weakness continues to take hold, USD/CAD may be the most attractive pairing of the three given that commodity drive from CAD/Oil.

On the risk side – keep in mind that there is still a longer-term falling wedge at play that hasn’t yet been nullified. The falling wedge is often approached with the aim of bullish reversals, and despite numerous threats of such over the past couple of months – that simply has not yet materialized. So, at this point, the focus remains on lower-lows to go along with the continued lower-highs – but if buyers are able to breach above recent resistance, which I’m tracking around the 1.2750 psychological level, then we may be in the midst of another bullish USD run as that longer-term formation begins to fil-in.
To learn more about falling wedge formations, join us in DailyFX Education
USD/CAD Daily Price Chart

Chart prepared by James Stanley; USDCAD on Tradingview
--- Written by James Stanley, Senior Strategist for DailyFX.com
Contact and follow James on Twitter: @JStanleyFX


