To receive James Stanley’s analysis directly via email, please SIGN UP HERE
- If you’re looking for trading ideas, check out our Trading Guides. And if you’re looking for ideas that are more short-term in nature, please check out our IG Client Sentiment.
- if you’d like to attend similar webinars, but in a live format, please check out our webinars calendar on DailyFX, where we have more than 20 live events every week.
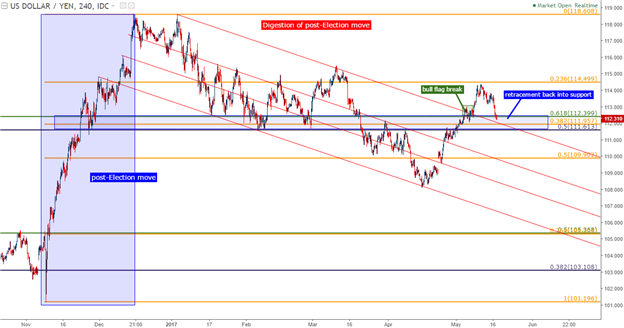
USD/JPY has been mired in a bit of a retracement over the past five trading days, and this has brought price action down to the confluent zone of support between ¥111.61-112.40. We had looked at this zone of support on Monday of this week, and within this zone are three Fibonacci retracement levels, combined with a trend-line projection.

Chart prepared by James Stanley
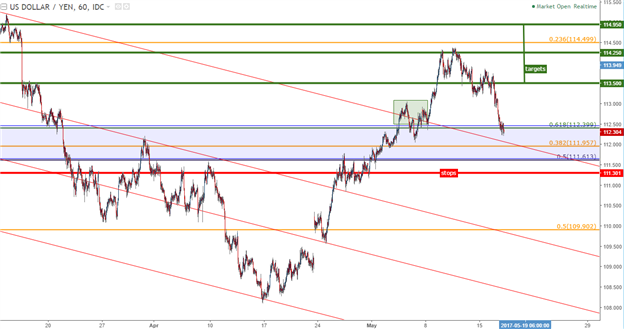
This opens the door for bullish-continuation plays, with stops placed below this confluent zone of support, and targets directed towards prior points of interest.
Stops are set to 111.30 to take on approximately 100 pips of risk; and targets are set to 113.50, 114.25 and 114.95. The stop will be adjusted to break-even after the first target.

Chart prepared by James Stanley
Long at Market 112.30
Stop at 111.30
Target 1: 113.50 – stop moved to break-even
Target 2: 114.25
Target 3: 114.95
--- Written by James Stanley, Strategist for DailyFX.com
To receive James Stanley’s analysis directly via email, please SIGN UP HERE
Contact and follow James on Twitter: @JStanleyFX


