


To receive James Stanley’s Analysis directly via email, please sign up here.
- If you’re looking for trading ideas, check out our Trading Guides. They’re free and updated for Q1, 2017. If you’re looking for ideas more short-term in nature, please check out our Speculative Sentiment Index Indicator (SSI).
This setup is fully explained in our EUR/JPY Technical Analysis article entitled, Higher-Low After Bullish Break post-ECB.
Coming into last week’s ECB meeting, EUR/JPY was finding short-term resistance around 121.00, and we had pointed out a key zone of confluent resistance a bit higher on the chart. If bulls were able to take out that zone of resistance, the prospect of top-side continuation became considerably more attractive. This zone is now showing as ‘higher-low’ support, and with a heavy dose of data on the calendar for the remainder of this week, the potential for continued bullish movement is certainly there.
Stops on the position can be set to below that prior batch of resistance around 121.00. A stop at 120.65 would be taking on approximately 123 pips of risk with current prices, and this could allow for a slightly better than 1:1 risk-reward ratio up to the key area of resistance around 123.10. If 123.10 comes into play, stops can be adjusted to break-even with eyes on deeper profit targets, set for 124.09, 125.00, and then 126.45.
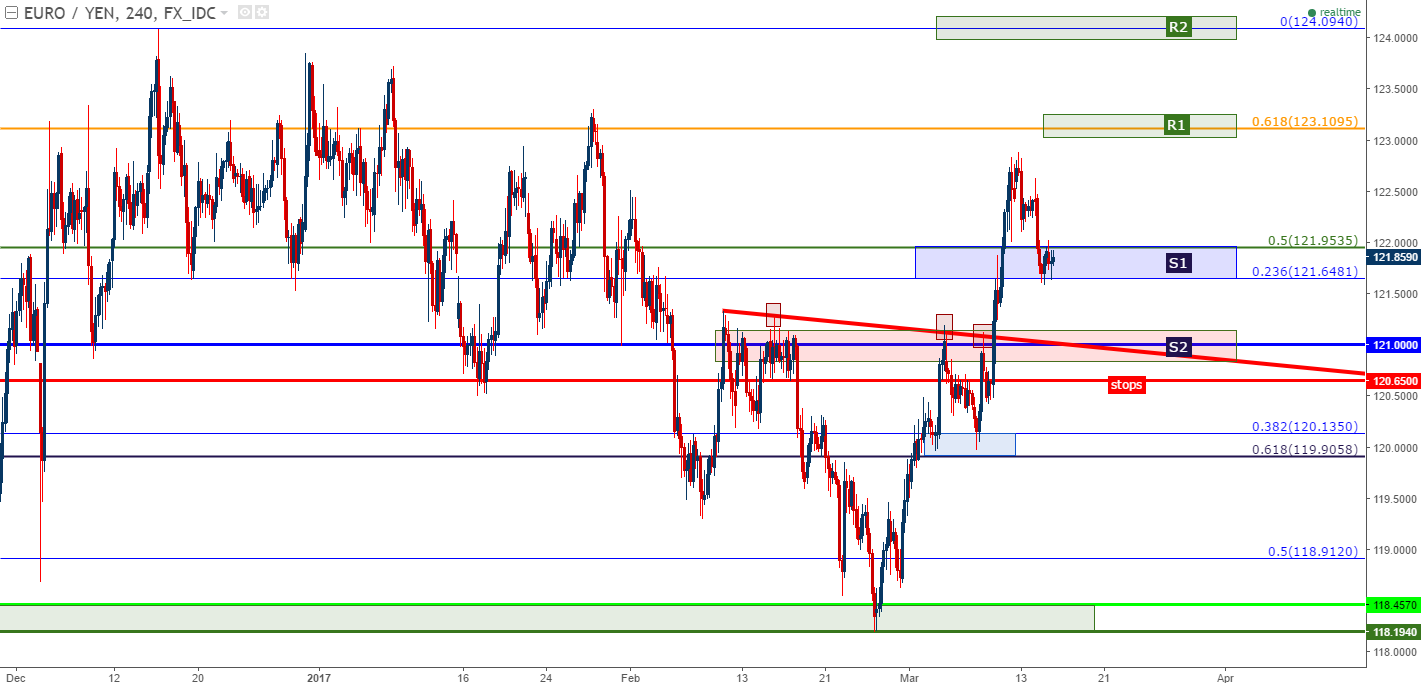
Chart prepared by James Stanley
--- Written by James Stanley, Strategist for DailyFX.com
To receive James Stanley’s analysis directly via email, please SIGN UP HERE
Contact and follow James on Twitter: @JStanleyFX


