


Australian Dollar, AUD/JPY, Ukraine, Europe, RBA, Technical Analysis – Analyst Pick
- Australian Dollar may rise against the Japanese Yen in the coming weeks
- Russia’s attack on Ukraine may boost Europe demand for Australian goods
- AUD/JPY broader uptrend in focus, what are key levels to watch ahead?

Fundamental Case for the Australian Dollar
The Australian Dollar has had an impressive push against the Japanese Yen this year so far. From a low of 80.36 in January to a high of 94.31 in March, this 17.4% rise has brought AUD/JPY to levels last seen in 2015. The broader uptrend since the 2020 pandemic-induced low thus remains intact. Might this momentum carry on in the coming weeks?
Bullish the Australian Dollar is my top trading opportunity for the second quarter. This is partly due to the potential economic windfall to Australia because of Russia’s attack on Ukraine. Europe needs to find alternatives to Russian goods it imports, such as steel and wheat. In addition, it may have to temporarily turn to non-renewable energy sources to power itself, such as coal.
This is where Australia comes into play. The country is a key exporter of iron ore and coal briquettes. It is also the world’s sixth-largest shipper of wheat. Europe could turn to Australia for some of these resources, boosting the latter’s trade surplus and bringing capital flows. If that translates into more economic growth, then the Reserve Bank of Australia may have to adopt a more hawkish monetary policy approach.
That seems to be the path forward following this month’s RBA rate decision. There are a couple of risks that traders should be wary of, however. The anti-risk JPY can appreciate when global market sentiment sours, which is very much possible amid an increasingly hawkish Federal Reserve. There is also the potential the Bank of Japan intervenes on Yen’s weakness. But that may be unlikely. BoJ board member Asahi Noguchi spoke recently, noting that ‘a weak Yen is a positive for the economy overall’.

AUD/JPY Technical Analysis
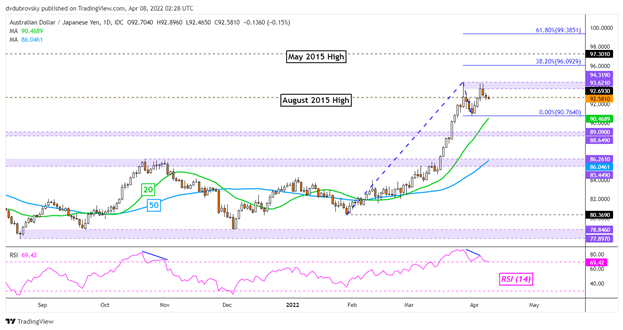
On the daily chart, AUD/JPY seems to have reinforced a key zone of immediate resistance. This is a range between 93.62 and 94.31. On the downside, key support is the March 31st low at 90.764. Clearing the latter could shift the technical outlook bearish. Negative RSI divergence does persist, showing that upside momentum is fading.
Clearing the resistance range may open the door to extending the uptrend, in line with the fundamental outlook. That would expose the 38.2% Fibonacci extension at 96.092 before the May 2015 peak at 97.301 comes into play. Above the latter is the 61.8% extension at 99.385. Now, let us take a look at the 4-hour chart to see what some levels are to watch for warnings of a turn lower.
Trade Smarter - Sign up for the DailyFX Newsletter
Receive timely and compelling market commentary from the DailyFX team
Daily Chart
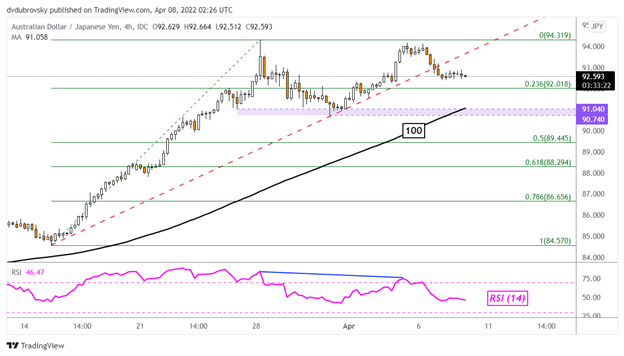
4-Hour Chart
Zooming in on the 4-hour chart does show that prices have pierced a rising trendline from March. Further downside would place the focus on the 90.74 – 91.04 support zone, as well as the 100-period Simple Moving Average. Clearing the latter could shift the outlook bearish, exposing the midpoint of the Fibonacci retracement at 89.445.
--- Written by Daniel Dubrovsky, Strategist for DailyFX.com
To contact Daniel, use the comments section below or @ddubrovskyFX on Twitter


