


Canadian Dollar, USD/CAD, Crude Oil, Bank of Canada, Coronavirus - Talking Points
- Majors-based Canadian Dollar index may confirm break under key support
- CAD has been falling with crude oil prices as coronavirus prompts BoC cut
- USD/CAD may rise towards the 2018 peak, supported by a rising trend line
Canadian Dollar Outlook May Deepen Bearish as Crude Oil Prices Fall on Virus Fears
The Canadian Dollar may be at risk to further losses against its major counterparts in the near term. Taking a look at a majors-based CAD index – which averages it versus USD, JPY, GBP and EUR – the currency may be on the verge of confirming a breakout under key rising support from 2018 – red lines on the chart below. That may open the door for the Loonie to see its cheapest level on average in about 2 years.

Declines in the Canadian Dollar has been closely tracking weakness in sentiment-linked crude oil prices, which have been accompanying the recent plunge in stock markets across the world. Wall Street has just come off its worst performance since 2008 amid the coronavirus outbreak, which is further threatening global growth. Gauges of Chinese economic activity revealed that the world's second-largest economy is rapidly contracting.
It is thus unsurprising that crude oil prices have declined over 30% from peaks in January as demand for travel declined. Airline industries are particularly under pressure in the Asia Pacific region with travel restrictions on the rise. Oil is a key source of revenue in Canada and falling prices could translate into softer local inflation, perhaps causing the Bank of Canada to consider supporting economic growth with monetary easing.
This week, the BoC delivered 50 basis points worth of easing. This brought its benchmark lending rate down to 1.25% from 1.75% as the central bank followed in the footsteps of the Federal Reserve. In response, Canadian 2-year government bond yields tumbled to their weakest since June 2017. This is as the 10-year rate declined to its weakest on record.
Majors-Based Canadian Dollar Index – Weekly Chart

Chart Created Using TradingView
Fundamental Risks – Bank of Canada, Jobs Data, OPEC, Crude Oil Prices
With that in mind, overnight index swaps are now fully baking in two BoC rate cuts by the end of this year. A third is priced in with greater than 50% probability. Given the room that the central bank has left to reduce rates towards 0 compared to some of its major counterparts, that is a vulnerability for the Canadian Dollar.
Risks the Canadian Dollar faces include February’s local jobs report as well as the non-farm payrolls report from the United States. Consumption is the top driver of growth for both economies and signs of weakness may deteriorate sentiment. That may in turn hurt oil prices, boosting USD/CAD. Efforts from the Organizational of the Petroleum Exporting Countries (OPEC) to cut supply and boost WTI may cushion CAD selling pressure.
Canadian Dollar Technical Analysis
USD/CAD is making another attempt to confirm an upside breakout through highs from August. That may pave the way for a revisit to highs from May 2019 on the path towards peaks from 2018. Yet, negative RSI divergence shows fading upside momentum which can precede a turn lower. Even so, rising support from January may down the road maintain the near-term uptrend if there is a temporary correction.
| Change in | Longs | Shorts | OI |
| Daily | 0% | -9% | -6% |
| Weekly | 48% | -10% | 3% |
USD/CAD Daily Chart
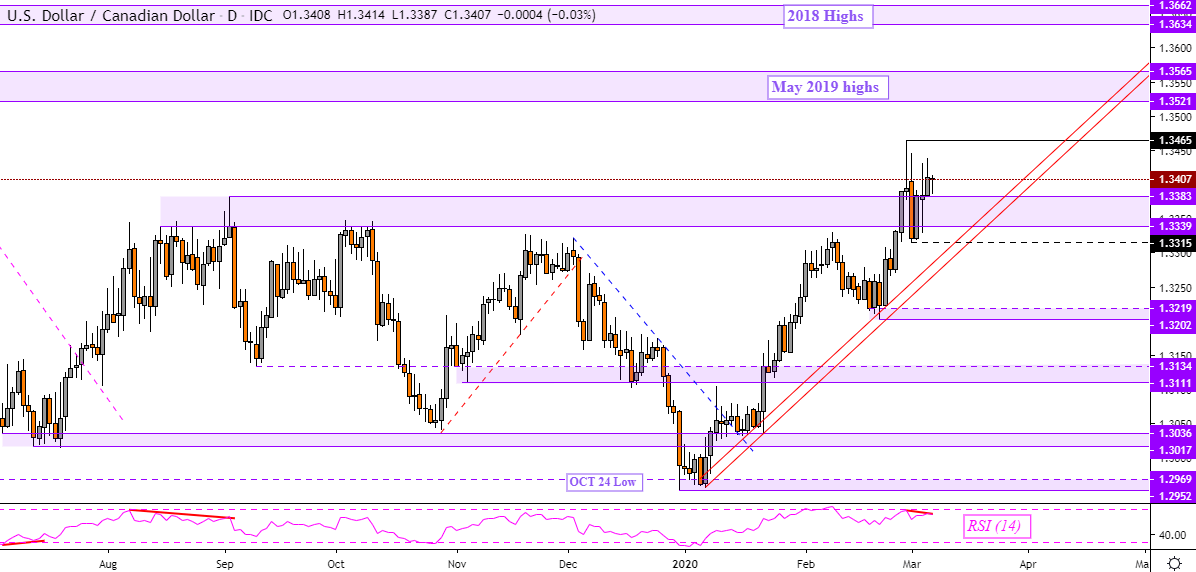
Chart Created Using TradingView
--- Written by Daniel Dubrovsky, Currency Analyst for DailyFX.com
To contact Daniel, use the comments section below or @ddubrovskyFX on Twitter


