
Crude Oil Prices Today

Oil - US Crude
Bearish
 27m
27m
Last updated:
Apr 18, 2024
| Low | |
| High |
of clients are net long.
of clients are net short.
Average True Range
Total Intraday Range (% of ATR)
Oil - Brent Crude
27m
Last updated:
Apr 18, 2024
| Low | |
| High |
Average True Range
Total Intraday Range (% of ATR)
Note: Low and High figures are for the trading day.
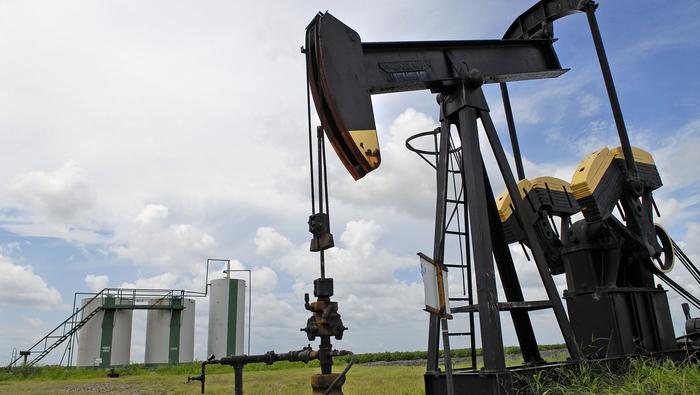
Crude oil is one of the most in-demand commodities, with the two most popularly traded grades of oil being Brent Crude and West Texas Intermediate (WTI). Crude oil prices reflect the market's volatile and liquid nature, as well as oil being a benchmark for global economic activity. The oil price charts offer live data and comprehensive price action on WTI Crude and Brent Crude patterns. Get information on key pivot points, support and resistance and crude oil news today.
Advertisement
News & Analysis

Market Sentiment Analysis and Outlook: Crude Oil, Dow 30, AUD/USD
2024-04-17 17:00:00
Market Sentiment Analysis and Outlook: Gold, WTI Crude Oil, S&P 500
2024-04-15 16:30:00
Oil Price Update: Israeli Troops Withdraw from the South, Peace Talks Underway
2024-04-08 11:04:00
Brent Crude Prices Hit $90 as Geopolitical Tensions Flare up
2024-04-05 12:05:12
EUR/USD and Oil – Awaiting Fibonacci Resistance Breakout for Bullish Continuation
2024-04-05 00:50:00
US Crude Oil Prices Surge As Market Seems Sure OPEC Cuts Will Stay Put
2024-04-03 13:30:41
Brent, WTI Reach Yearly High amid Escalations in Russia and Middle East
2024-04-02 13:49:47
Real Time News

Apr 18, 2024
Follow
Commodities Update: As of 07:00, these are your best and worst performers based on the London trading schedule:
Silver: 0.78%
Gold: 0.74%
Oil - US Crude: -0.53%
View the performance of all markets via https://t.co/WHTs8622rG https://t.co/osjYF1qlXl

Apr 18, 2024
Follow
Commodities Update: As of 02:00, these are your best and worst performers based on the London trading schedule:
Gold: 0.46%
Silver: 0.44%
Oil - US Crude: 0.04%
View the performance of all markets via https://t.co/WHTs8622rG https://t.co/qb65jOT3bt

Apr 17, 2024
Follow
Commodities Update: As of 20:00, these are your best and worst performers based on the London trading schedule:
Silver: 0.62%
Oil - US Crude: 0.07%
Gold: -0.46%
View the performance of all markets via https://t.co/WHTs862Ahe https://t.co/xaYfMvImk0


IG Client Sentiment
Oil - US Crude
Bearish
Daily change in
Longs
8%
Shorts
-14%
OI
1%
Weekly change in
Longs
36%
Shorts
-33%
OI
7%
Advertisement

Advertisement