


Pennants are continuation patternsthat appear in the forex market and are used by traders to predict upcoming market movements. While similar to the triangle pattern, the Pennant pattern has some important differences that traders need to be aware of.
In this article, you will learn how to recognize Pennant chart patterns, what they mean, what causes them and, most importantly, how to use them to place more effective trades.

What is a Pennant Pattern?
A Pennant pattern is a continuation chart pattern, seen when a security experiences a large upward or downward movement, followed by a brief consolidation, before continuing to move in the same direction. The pattern looks like a small symmetrical triangle called a Pennant, which is made up of numerous forex candlesticks. Depending on the direction of the movement, Pennant patterns are usually described as being bearish or bullish.
Key characteristics of a Pennant pattern
When looking at a Pennant continuation pattern, you will see the following:
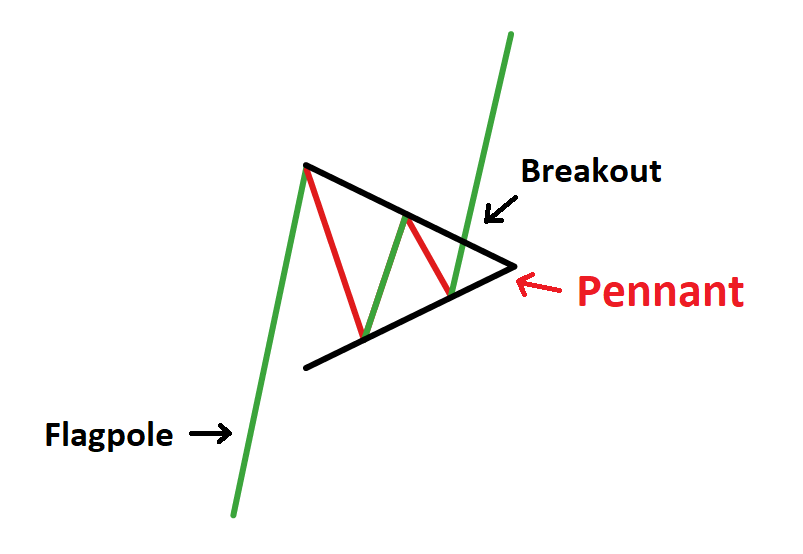
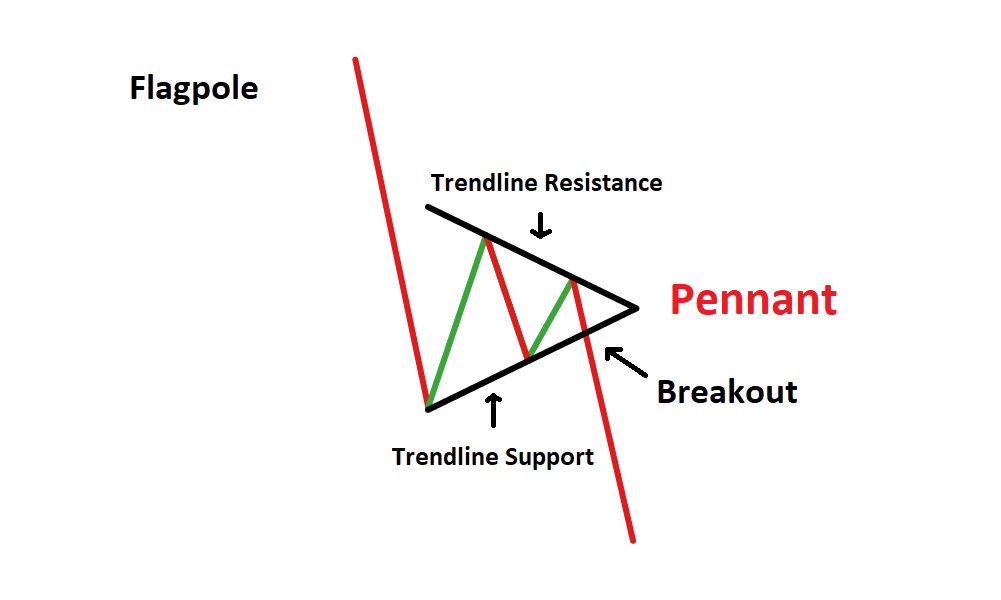
- A flagpole: A Pennant pattern always begins with a flagpole, which differentiates it from other types of patterns (such as the symmetrical triangle). The flagpole is the initial strong move preceding the symmetrical triangle.
- Breakout levels: There will be two breakouts, one at the end of the flagpole, and one after the consolidation period, where the upward or downward trend continues
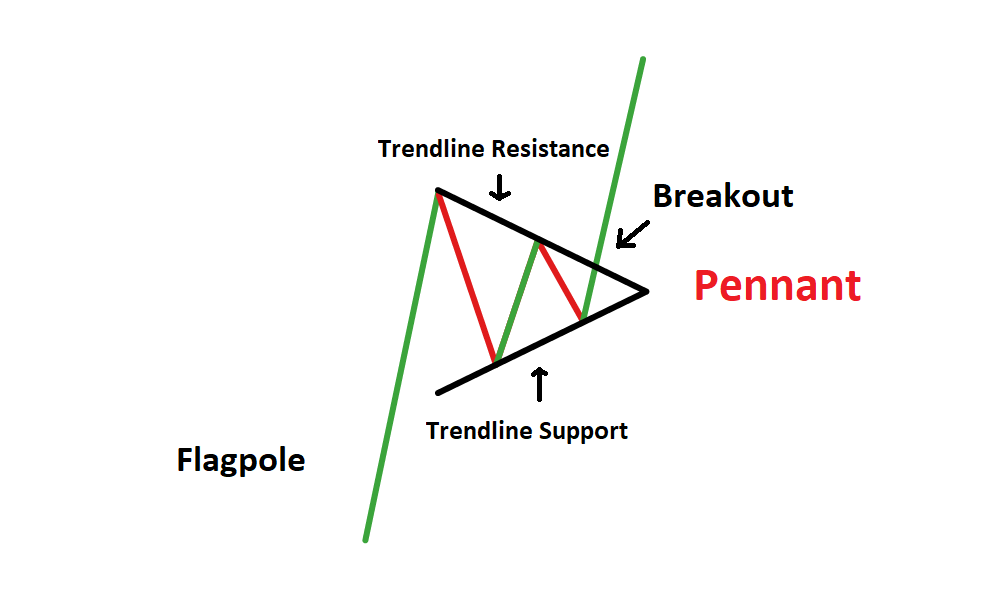
- The Pennant itself: The Pennant is the triangular pattern formed when the market consolidates, between the flagpole and the breakout. The two converging trendlines form the triangle - the Pennant.
These characteristics can be seen below, with respect to the Bullish Pennant Pattern.
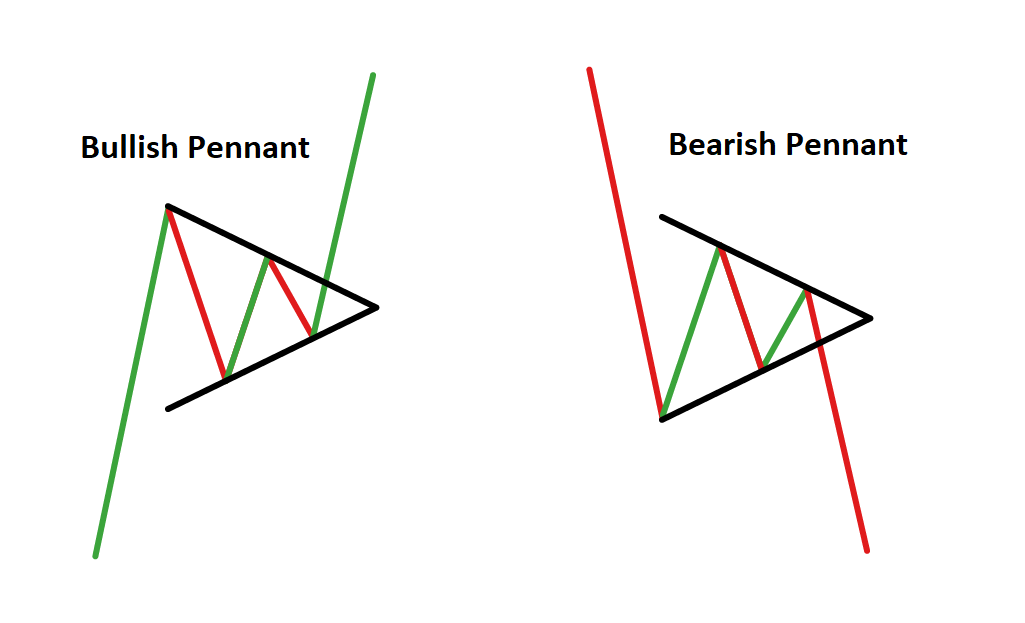
Bullish Pennants
Bullish Pennants are continuation candlestick patterns that occur in strong uptrends. The Pennant is formed from an upward flagpole, a consolidation period and then the continuation of the uptrend after a breakout. Traders look for a break above the Pennant to take advantage of the renewed bullish momentum.
Bearish Pennants
Bearish Pennants are simply the opposite of the Bullish Pennant. Bearish Pennants are continuation patterns that occur in strong downtrends. They always start with a flagpole – a steep drop in price, followed by a pause in the downward movement. This pause forms a triangular shape, known as the Pennant. There is then a breakout, and the downward movement continues. Traders look to enter short trades on a break below the pennant.
Knowing the difference between Pennant patterns and triangle patterns
Pennant patterns are very similar to triangle patterns, but there are some important differences between a forex Pennant and a forex triangle that should be acknowledged in order to trade either pattern successfully.
These are the key differences to note:
- A Pennant pattern has to be preceded by a strong up or down move that resembles a flagpole. If there isn’t a flagpole, then it's a triangle and not a Pennant.
- A Pennant tends to form a shallow retracement (typically less than 38% of the flagpole). A deep retracement is indicative of a triangle rather than a Pennant.
- A Pennant is characterized by the continuation of the upward or downward trend.
- A Pennant is a short-term pattern that is usually completed within one to three weeks. A triangle pattern usually takes much longer to form.
How to Trade Bullish and Bearish Pennants
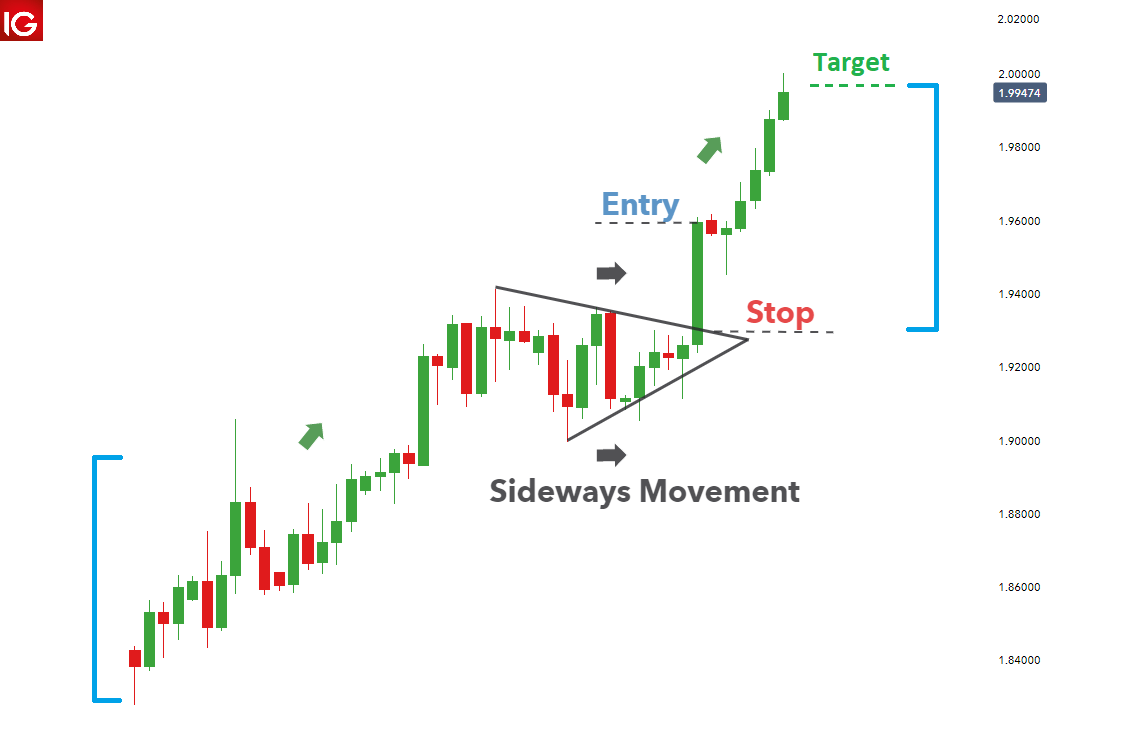
When trading, the same approach can be applied to both the Bullish and Bearish Pennant patterns however, the Bullish Pennant will have a long bias and the Bearish Pennant, a short bias. The example below demonstrates how to trade a Bullish Pennant appearing in GBP/NZD.
Traders should look to enter the trade on confirmation of the breakout after a sudden, sharp move in price. The pennant, after a sharp move in price, indicates that there is likely to be a breakout and continuation in the direction of the initial move.
A candlestick close above the pennant provides the entry point. In this example the break was rather significant and added to the likelihood of a continued move to the upside.
A stop loss can be placed at the low of the breakout candle, seeing that it was quite a big move or, for more conservative traders, a stop can be placed beneath the pennant to limit downside risk. This usually offers an acceptable level of protection for traders.
Keep in mind that the markets don’t always move in the way you expect which is why traders should always adopt prudent risk management. To account for this, only ever trade with capital that you can afford to lose.
To set target levels, traders can measure the distance from the beginning of the flagpole up to the Pennant, then duplicate this distance from the price break out following the Pennant.
Further Reading on Forex Trading Patterns
How well do you know your forex trading patterns? Take our forex patterns quiz to test your knowledge, and explore our articles on candlesticks: