


The Bollinger Bandwidth indicator can provide invaluable signals for technical traders, and when combined with other technical indicators and price action techniques, gives traders insight into both volatility and potential reversals in the forex market.
Before reading further, be sure to understand the basics of the Bollinger Band®
This article explores:
- What is the Bollinger Bandwidth Strategy?
- How does the Bollinger Bandwidth indicator work?
- How to calculate Bollinger Bandwidth
- Applying the Bollinger Bandwidth Strategy: Top Tips
- Advantages and Limitations of the Bollinger Bandwidth strategy
What is the Bollinger Bandwidth Strategy?
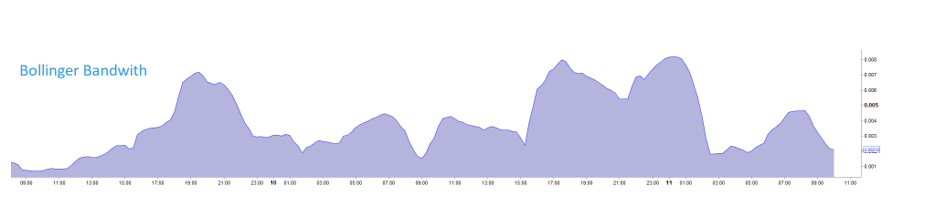
The Bollinger Bandwidth strategy uses the Bollinger bandwidth indicator to measure the difference in percentage between the upper and lower bands of the traditional Bollinger Band® indicator. On most charting platforms, the Bollinger Bandwidth indicator is represented beneath the primary chart as an oscillator type layout (see image below).
How does the Bollinger Bandwidth indicator work?
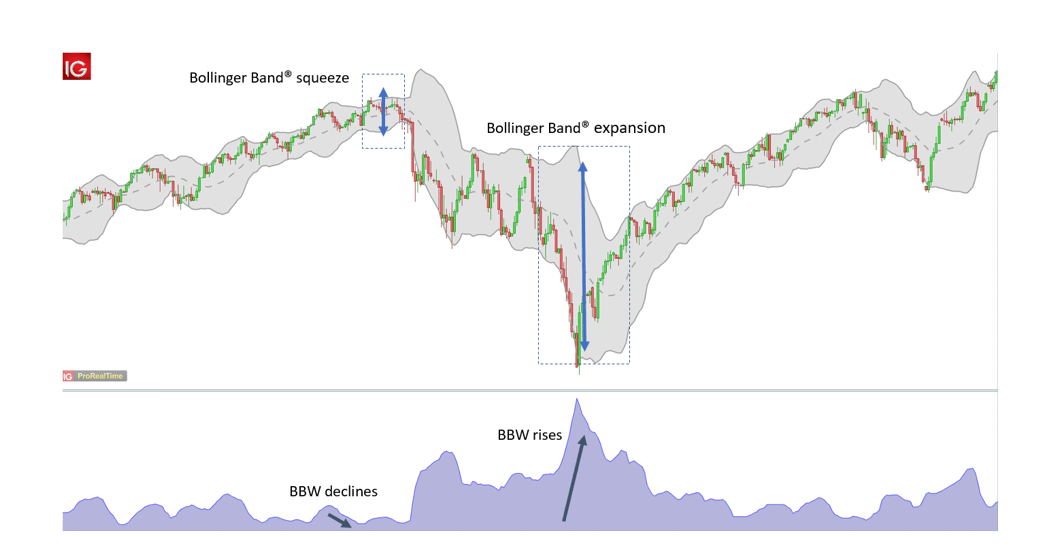
The Bollinger Bandwidth indicator illustrates periods of varying volatility relative to the market price movement. The chart below shows how volatility falls when the Bollinger Band® width contracts and rises when the width expands. After periods of consolidation (low volatility), it is often noted that price tends move in an asserted fashion either up or down. Contrary to this, when the Bollinger Bandwidth indicator increases to relative highs (high volatility), this regularly signals a reversal in current trend.
How to calculate Bollinger Bandwidth
The Bandwidth formula is:
Bandwidth = (Upper Bollinger Band® - Lower Bollinger Band®)/Middle Bollinger Band®

Applying the Bollinger Bandwidth Strategy: Top Tips
Traders can trade with the Bollinger Bandwidth indicator in several different ways but two of the most common ways to trade with this indicator involve breakout and reversal movements.
Bollinger Bandwidth low volatility strategy
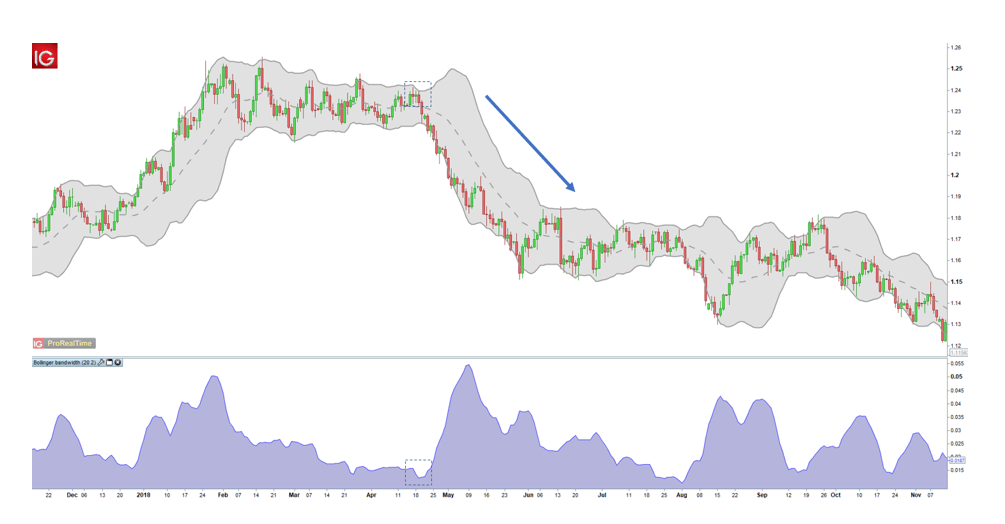
The image above represents a daily EUR/USD chart. The highlighted portion on the chart and Bollinger Bandwidth indicator signifies low volatility and a period of consolidation (sideways movement). Traders see this tightening of the Bollinger Band® as an indication that an abrupt move is likely to occur soon after.
Unfortunately, the Bollinger Bandwidth indicator does not offer any further trade support which is why traders rely on other trading techniques to confirm entry and exit levels. This can be taken from price action, Bollinger Band® and other technical methods.
Bollinger Bandwidth reversal strategy

Looking at the increase in volatility or higher Bollinger Bandwidth value on the USD/JPY daily chart, it shows USD/JPY reaching new lows outlined by the square boxes. This parabolic movement in price and rising volatility does hint at a potential trend reversal (to the upside in this case).
This example also provides further supporting evidence with the long wick candle formation, indicating a rejection of the new low by bulls. As mentioned previously, the Bollinger Bandwidth indicator does not specify entry/exit levels so other tools need to be used in conjunction. Fibonacci level s are often used to determine theses entry/exit levels as well as price action trend lines to establish support and resistance points.
Advantages and Limitations of the Bollinger Bandwidth strategy
| Advantages | Limitations |
|---|---|
| Easy to access and understand | Requires use of supporting technical tools and indicators |
| Identifies strong potential movements in price (high risk-reward ratios) | Utilised in different circumstances which can be tricky for novice traders to distinguish between the respective methods |
Further reading on Bollinger Bands®
- Bollinger Bands® provide traders with a visual representation of volatility in the market. Learn more with our guide to trading forex with Bollinger Bands®
- Read Day trading Bollinger Bands® to get to grips with a Bollinger scalping strategy.
- Another approach to incorporate into your trading strategy is the Bollinger Bands® and MACD combination.
