


The ascending triangle, often referred to as the ‘rising triangle’, is one of the top continuation patterns that appears mid-trend. Traders anticipate the market to continue in the direction of the larger trend and develop trading setups accordingly.

Learn to Trade the Ascending Triangle Pattern: Main Talking Points
- Definition of an ascending triangle
- Identifying an ascending triangle pattern on forex charts
- How to trade the ascending triangle
- Advantages and limitations of the ascending triangle
Test your knowledge of forex patterns with our interactive Forex Trading Patterns quiz
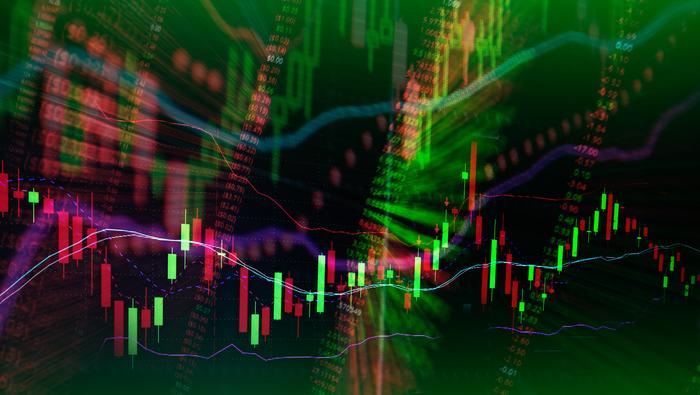
What is an Ascending Triangle?
The ascending triangle is a bullish continuation pattern and is characterized by a rising lower trendline and a flat upper trendline that acts as support. This pattern indicates that buyers are more aggressive than sellers as price continues to make higher lows. The pattern completes itself when price breaks out of the triangle in the direction of the overall trend.
The Ascending Triangle as a Bottoming Pattern
The location of the ascending triangle in relation to the trend will determine whether a reversal or continuation of the trend is more likely to occur. It is possible for the ascending triangle to appear at the bottom of a downtrend, indicating that the downward momentum is fading before potentially changing direction. Therefore, the location the pattern appears in is crucially important.
How to identify an Ascending Triangle Pattern on Forex Charts
The ascending triangle is fairly easy to spot on forex charts once traders know what to look for.
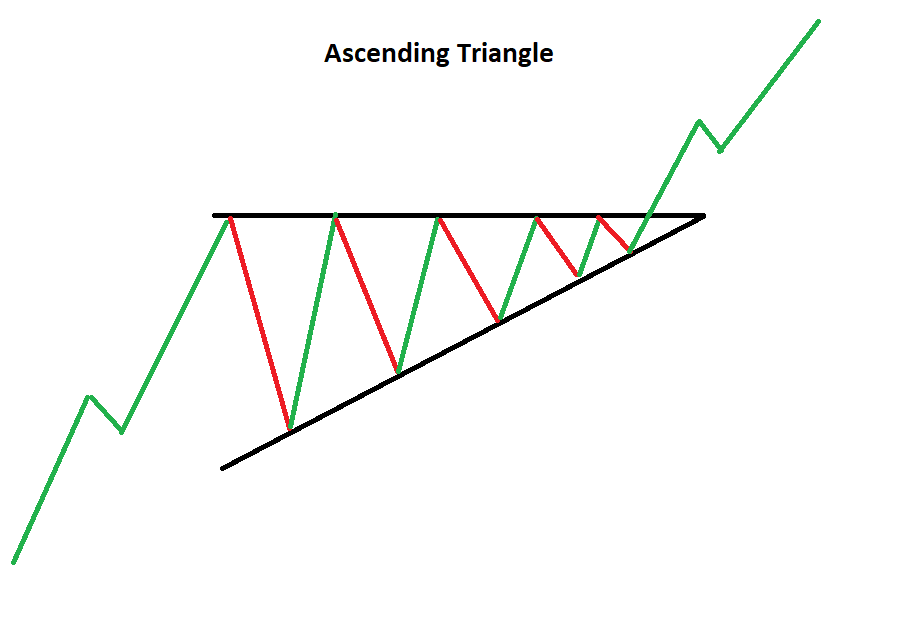
- Uptrend: The market must be in an uptrend before the ascending triangle appears. This is important and emphasises that traders should not simply trade the pattern whenever the ascending triangle appears.
- Consolidation: The ascending triangle starts to take on its form as the market enters the consolidation phase.
- Rising lower trendline: While the market is consolidating, a rising trendline can be drawn by connecting the lows. This ascending trendline shows that buyers are slowly pushing the price up – which provides further support for a bullish trading bias.
- Flat upper trendline: The upper trendline acts as resistance. Price often approaches this level and bounces off until the breakout eventually occurs.
- Trend continuation: After price posts a strong break above the upper trendline, traders will look for confirmation of the pattern via continued upward momentum.
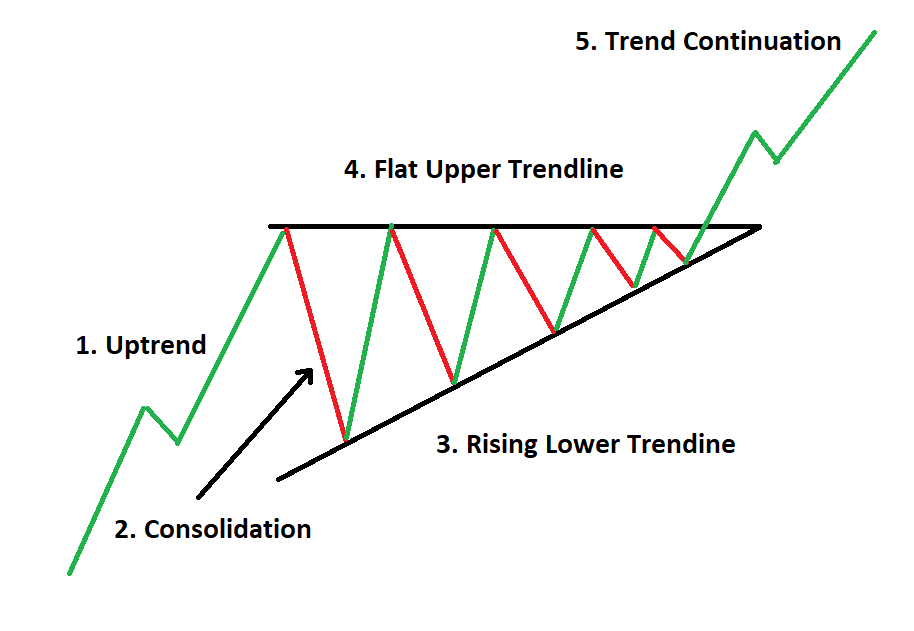
Ascending Triangle Measuring Technique
The ascending triangle has an inherent measuring technique that can be applied to the pattern to gauge likely take profit targets.
For the ascending triangle,traders can measure the distance from the start of the pattern, at the lowest point of the rising trendline to the flat support line. That same distance can be transposed later on, starting from the breakout point and ending at the potential take profit level.
The illustration below shows the distance from A to B can be transferred higher up, from C to D, in order to project a possible take profit level.
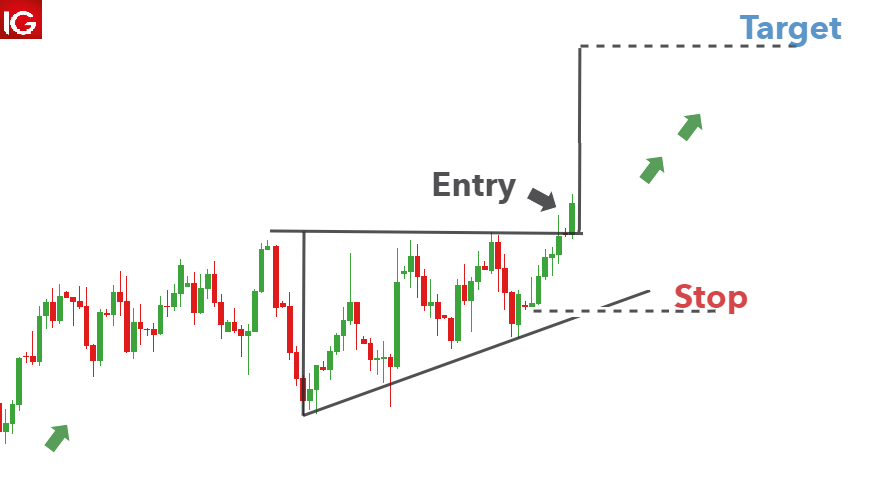
How to Trade the Ascending Triangle
When trading the ascending triangle, traders need to identify the uptrend and this can be seen in the USD/CAD chart below. Thereafter, the ascending triangle appears as the forex candlesticks start to consolidate. The measuring technique can be applied once the triangle forms, as traders anticipate the breakout.
After viewing a strong break above resistance, traders can enter a long position, setting a stop at the recent swing low and take profit target in line with the measuring technique.
Advantages and Limitations of the Ascending Triangle
The ascending triangle is an incredibly helpful pattern when assessing potential trend continuations. It does, however, have its shortcomings and traders ought to be aware of both.
| Advantages | Limitations |
|---|---|
| Easy pattern to identify | False breakouts are possible (traders need to manage risk accordingly) |
| The ascending triangle produces a clear target level – based on the max height of the ascending triangle | There is always a chance that price moves sideways for an extended period of time or even moves lower |
| Since this is an intermediate-term pattern, traders have the option to trade within the triangle but should filter trades in the direction of the trend |
Further Reading on Forex Trading Patterns
- The ascending triangle is just one of many bullish trading patterns. Others include the bullish Pennant, bullish flag and the rising wedge, to name a few.
- To test your understanding of forex trading patterns, take our forex trading patterns quiz.
- If you are just starting out on your trading journey it is essential to understand the basics of forex trading in our free New to Forex trading guide.