


The Relative Strength Index (RSI) is a simple oscillator that is used to measure speed or inertia of a given price move. The objective is to identify times when market may be in an overbought / oversold condition. While the concept is quite simple, the indicator is often times the most miss-used and under-utilized oscillator.

Before we begin, it’s worth nothing that all oscillators are backwards looking- that is they are giving you a description of historical price action – not forward looking. It is with this humble regard that we approach momentum studies and while there is much we can derive from this indicator, never base a trade solely on one technical factor. Rather this should be used as a tool within a broader technical approach to price action. Now, lets dive in.
Everyone has heard of a market that is overbought or oversold – typically an RSI reading above 70 is considered to be overbought and below 30, oversold. But what does this mean for us from a trading standpoint? The misconception is that an overbought / oversold reading IS in itself the signal is one of the first major pit-falls of this indicator. A simple historical study of price action shows that often times the market has the most thrust when markets are trading above 70 in RSI and within a broader uptrend. Likewise, the largest declines can often be seen after momentum has broken below 30 within the confines of downtrends.
Gold Price Chart – XAU/USD Weekly
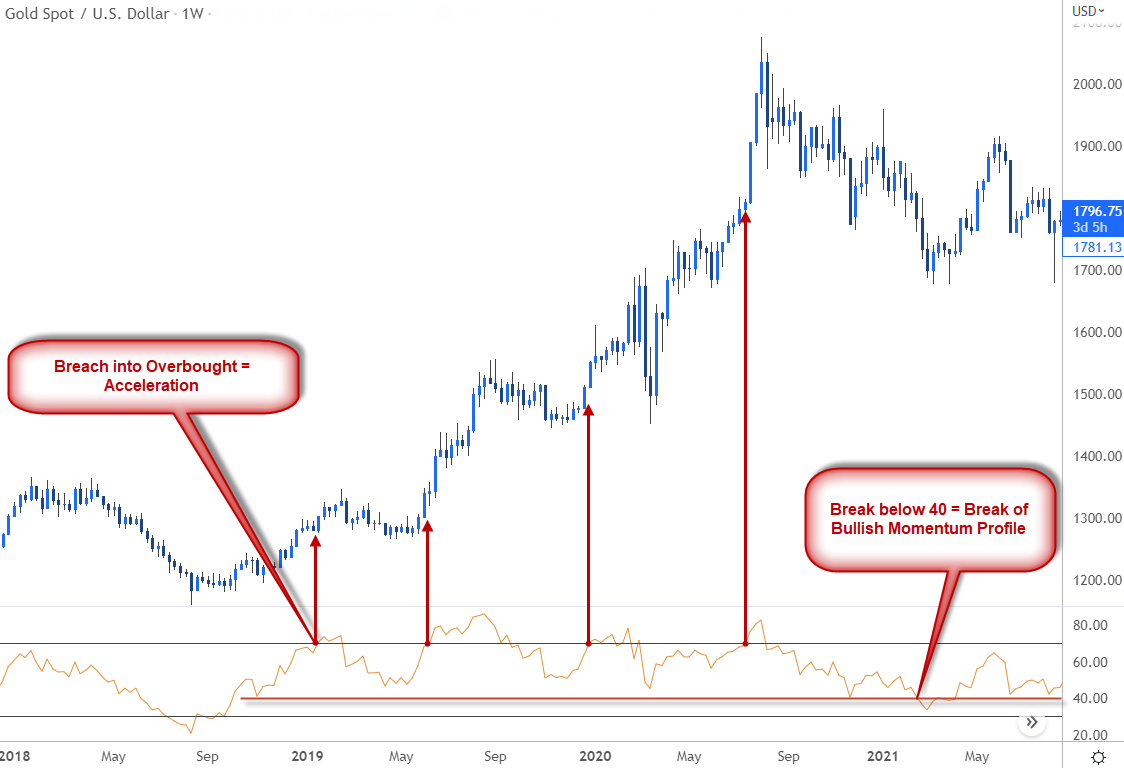
Chart Prepared by Michael Boutros , Technical Strategist; Gold on Tradingview
The key is to remember that RSI has no time value – markets can remain in an overbought / oversold condition for an indefinite time period. In fact, the sharpest part of the rally or decline is often times after momentum has broken into the extreme. The signal, that exhaustion may be ahead is the return from the extreme- IE back the move back above 30 / back below 70. Recognizing this simple fact can help you avoid trying to call the high or fade something just because of a stretch in to momentum.
Another aspect of RSI that is often overlooked is what I call the momentum profile. A basic rule of thumb is that in strong bull-markets, RSI should typically hold above 40 – likewise in a bearish trends the oscillator will tend to find resistance at ahead of 60. These subtle tendencies can be very useful in assessing the broader directional bias from a moment standpoint and whether a move is corrective within a broader trend or a larger reversal.
Foundational Trading Knowledge
Forex for Beginners
New to Forex? Get started with this Free Beginners Guide!
Sterling Price Chart – GBP/USD Weekly
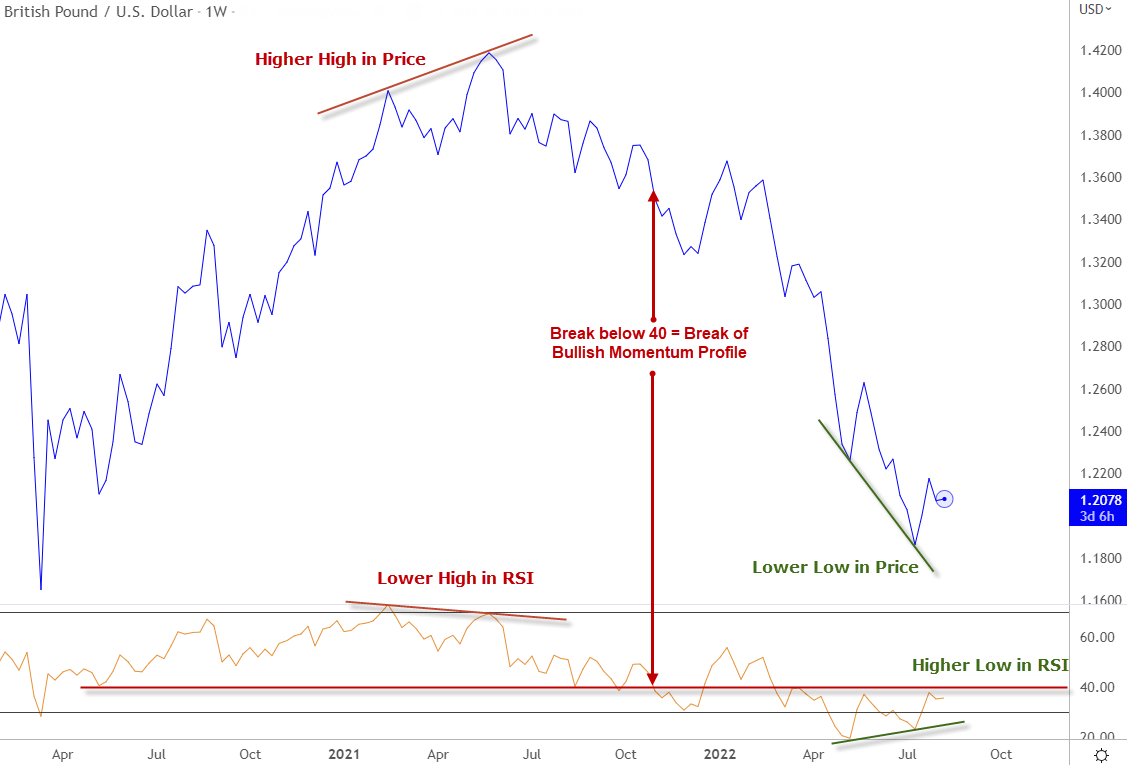
A note on divergence – Divergence is a phenomena where a new extremes in price are not reflected in the oscillator. This tendency can often times help identity market turns / reversals. However its important to note that it is the candle close that matters – not the wicks (high / low). An easy way to help filter out the noise is to simply consider divergences on a line chart, taking account only the period close. The Sterling chart above illustrates both bullish / bearish divergence signals and shifts in the broader momentum profile. It’s worth noting that the closer the divergence reference points are to 50- the stronger the signal. So in this example, the bearish divergence seen in 2021 would be interpreted as a stronger signal than that of this year’s rebound in GBP/USD.
Learn How to USE IG Sentiment in Your Trading

Bottom line : All oscillators should be used in as a compliment to a broader trade strategy and there should never be an over-reliance on any one indicator other than price. That said, momentum can be an extremely useful tool when used properly and offers much more insight than simple overbought / oversold readings within the confines of a given trend. Forget the cookie-cutter explanations - knowing how a given indicator behaves to real-life price action is the key to effectively utilizing them as part of you trading strategy.
-Written by Michael Boutros , Technical Strategist with DailyFX
Follow Michael on Twitter @MBForex