


US Dollar Vs Euro, British Pound, Australian Dollar – Price Setups:
- The US dollar’s trend remains weak ahead of the Fed rate decision.
- Fed is widely expected to hike by 25 bps, but key focus will on its forward guidance.
- What’s next for EUR/USD, GBP/USD, and AUD/USD?

The US dollar’s trend broadly remains down ahead of the US Federal Reserve’s interest rate decision However, the slide appears to be losing some steam, leaving open the possibility of a minor rebound in the short term.
The Fed is widely expected to raise interest rates by 25 basis points today (rate decision due 1800 GMT). The key focus will be on its guidance on the path of monetary policy – particularly, whether it plans to pause or raise rates further in June. Core measures of inflation appear to be in a cooling phase, but still way above the Fed’s 2% target.
EUR/USD Daily Chart
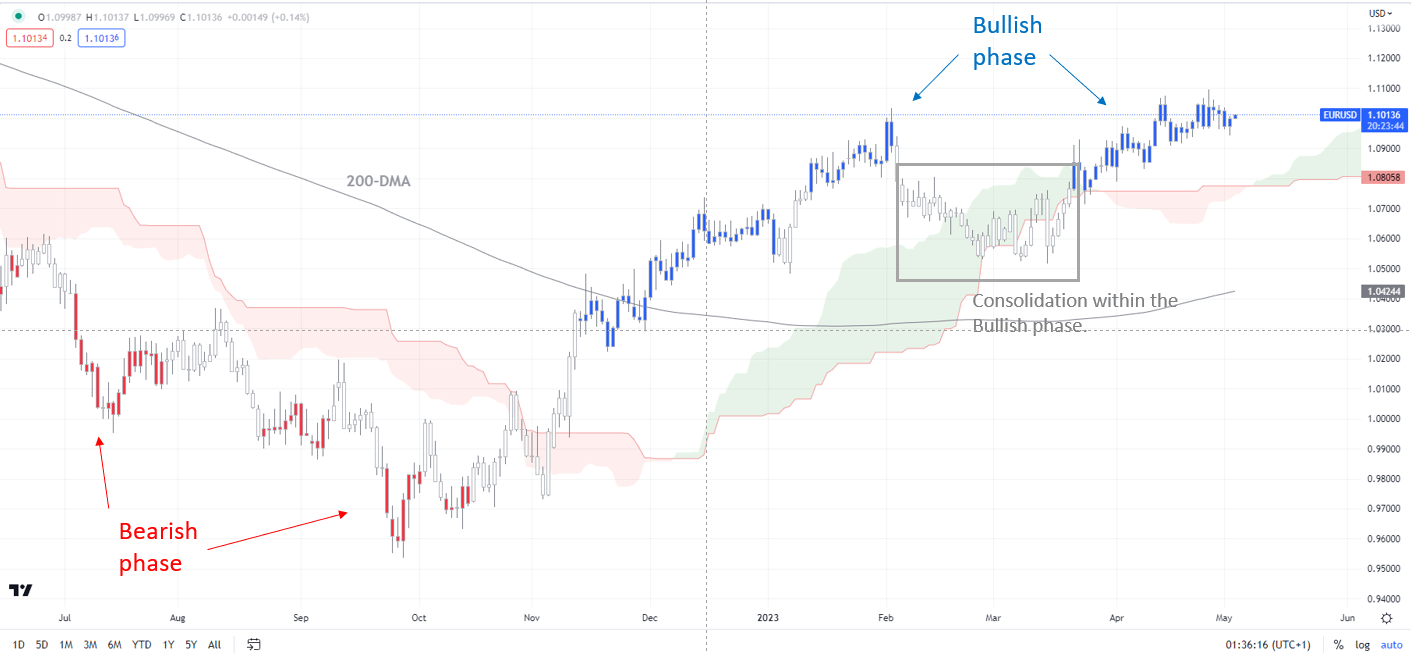
Chart Created by Manish Jaradi Using TradingView
Note: In the above colour-coded chart, Blue candles represent a Bullish phase. Red candles represent a Bearish phase. Grey candles serve as Consolidation phases (within a Bullish or a Bearish phase), but sometimes they tend to form at the end of a trend. Note: Candle colors are not predictive – they merely state what the current trend is. Indeed, the candle color can change in the next bar. False patterns can occur around the 200-period moving average, or around a support/resistance and/or in sideways/choppy market. The author does not guarantee the accuracy of the information. Past performance is not indicative of future performance. Users of the information do so at their own risk.
With the market pricing in roughly 50 basis points of rate cuts by the end of the year, any signal from the Fed contrary to the market’s expectations could lead to a rebound in the USD. Meanwhile, US macro data have been underwhelming since late March – the US Economic Surprise Index is at its lowest level since early February.
EUR: Minor signs of fatigue
On technical charts, the upward momentum in EUR/USD has slowed somewhat giving an impression of fatigue in the rally. Any break below immediate support at the mid-April low of 1.0900 would indicate that the upward pressure had faded a bit in the short term. Stronger support is around 1.0700-1.0725, including the 89-day moving average, and the lower edge of the Ichimoku channel on the daily charts.
EUR/USD 240-minute Chart
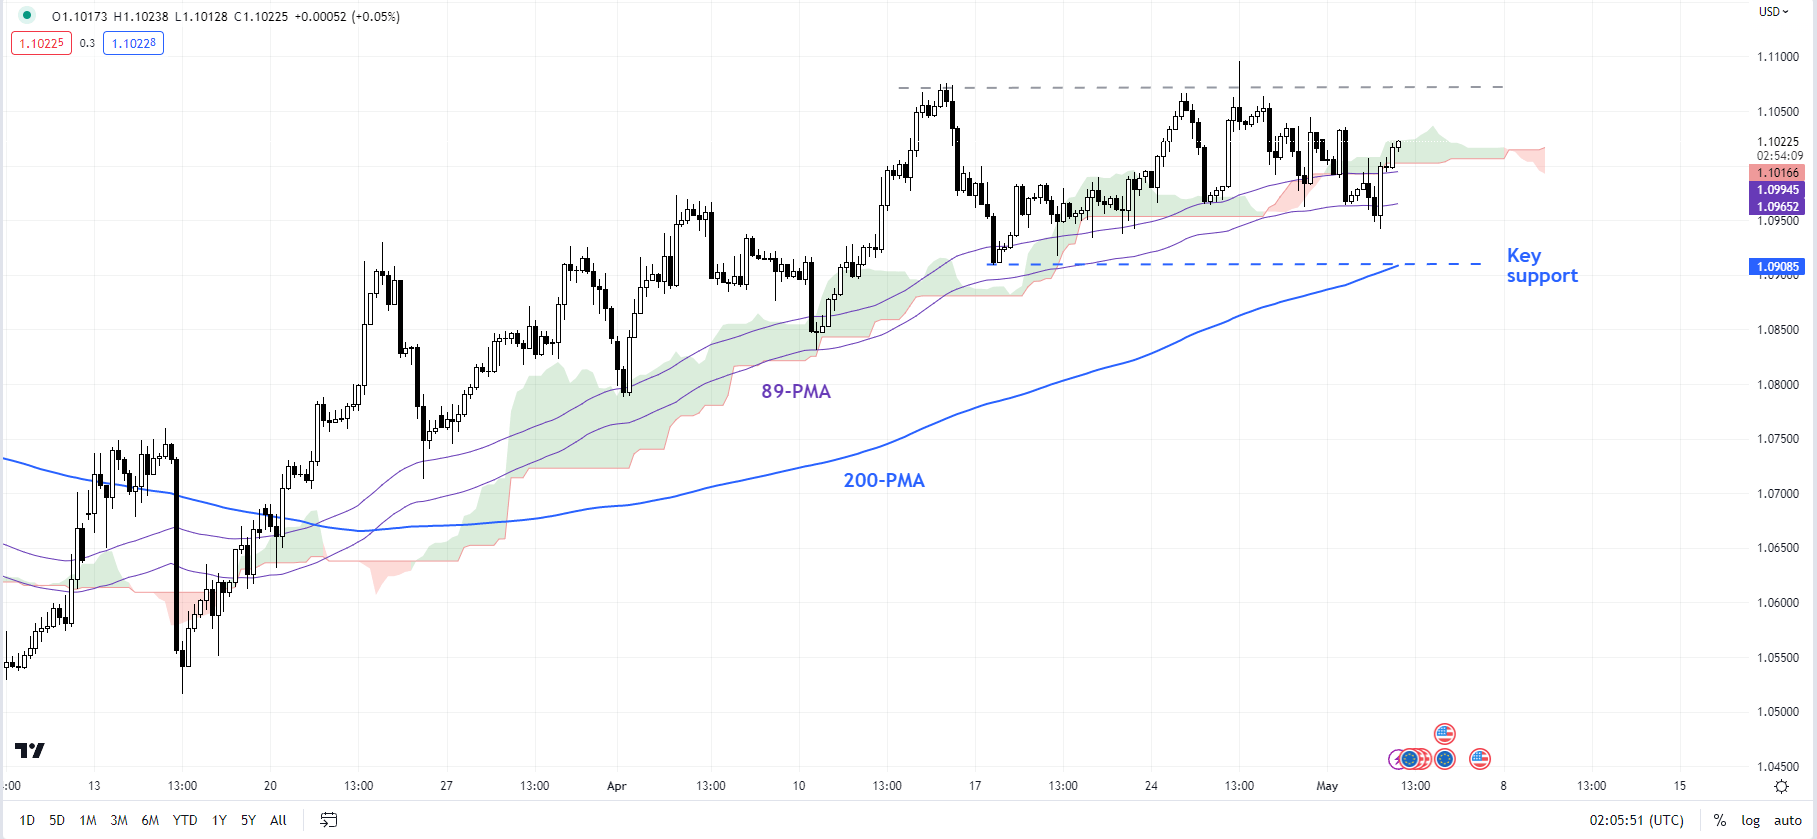
Chart Created by Manish Jaradi Using TradingView
EUR/USD’s broader trend remains up on the daily charts as colour-coded candlestick charts based on trending/momentum indicators show. For more discussion, see previous updateson April 10,April 13, and April 25. On the upside, a decisive break above the February high of 1.1035 could pave the way toward 1.1700 -- the price objective of the double bottom pattern (the January and March lows).
GBP/USD Daily Chart
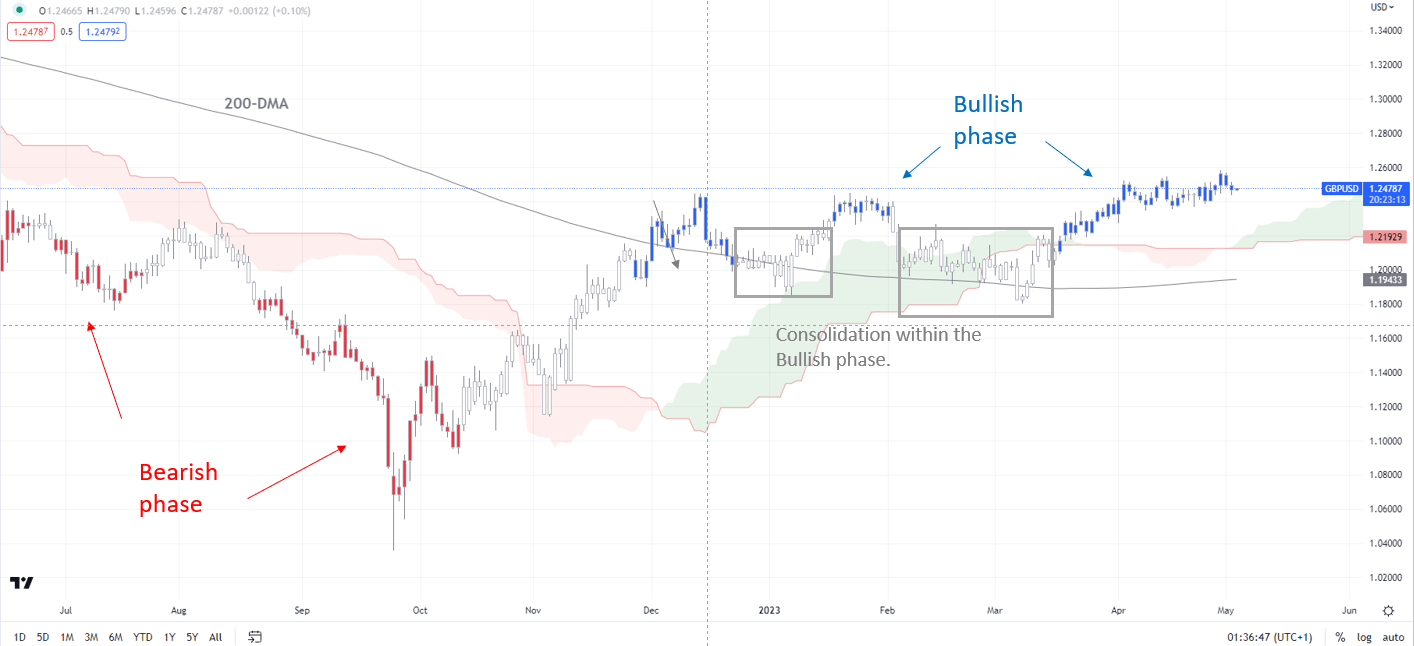
Chart Created by Manish Jaradi Using TradingView
GBP/USD: Consolidation could continue a bit further
As highlighted in the previous update, GBP/USD’s broader trend is up on the daily charts, as shown by the colour-coded candlestick charts based on trend/momentum indicators. However, despite repeated attempts in recent weeks, GBP/USD hasn’t been able to decisively clear above the top end of a sideways channel since the end of 2022 at about 1.2450. Any break below immediate support at the April 17 low of 1.2350. Any break below could pave the way toward 1.2150-1.2200.
AUD/USD Daily Chart
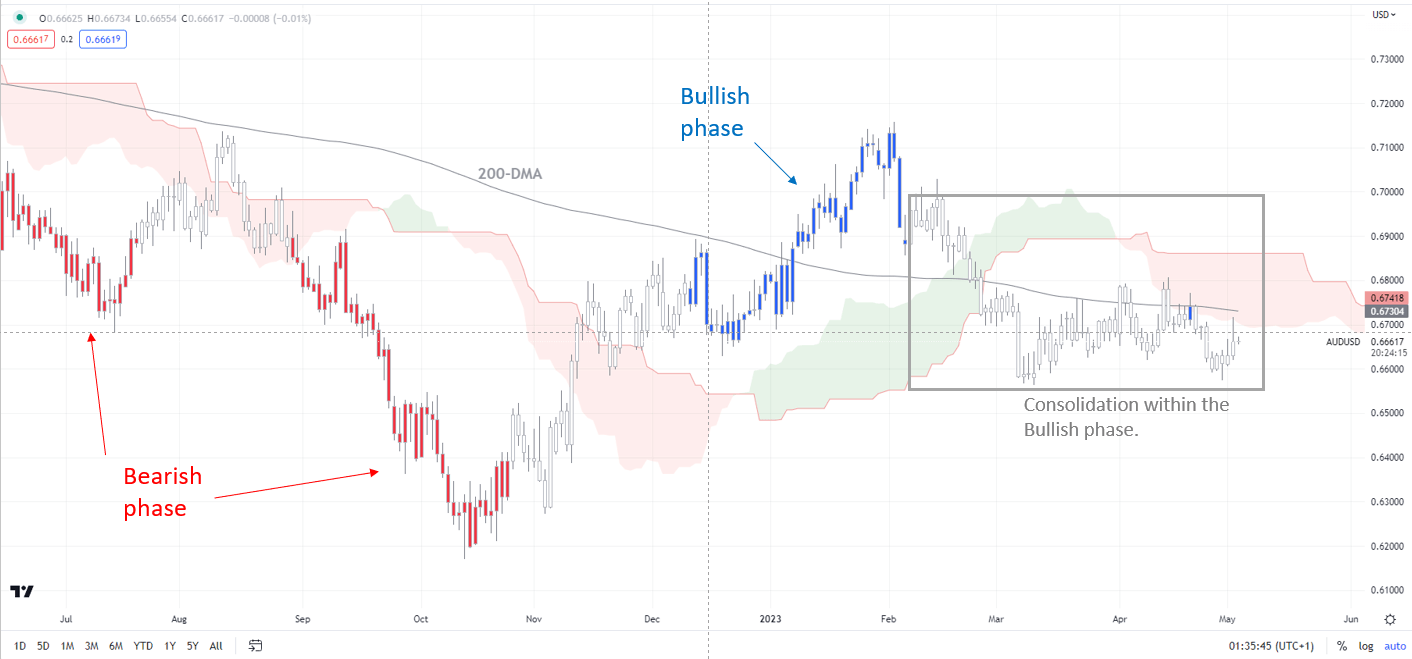
Chart Created by Manish Jaradi Using TradingView
AUD/USD: Lacking meaningful upward momentum
AUD/USD’s rebound in recent weeks has been capped around the 200-day moving average, roughly coinciding with the early-April high of 0.6795. Moreover, the two attempts to rebound in April ran out of steam around 38.2% retracement of the February-March decline – for a reversal of the weakness since January, AUD/USD would need to retrace at least more than 50%. Until then, the path of least resistance remains sideways to down. SeeApril 25andApril 27updates. On the downside, below the March low of 0.6550, the next support is 0.6385.
Trade Smarter - Sign up for the DailyFX Newsletter
Receive timely and compelling market commentary from the DailyFX team
--- Written by Manish Jaradi, Strategist for DailyFX.com
--- Contact and follow Jaradi on Twitter: @JaradiManish


