


Indices Talking Points:
- It was a bearish week for stocks with a push-lower after the FOMC rate decision on Wednesday, but a Friday bounce into the end of the week has many looking for another bear market bounce scenario. But there are some major points of resistance to be dealt with first before that scenario starts to look more likely.
- The big macro driver for this week is another release of CPI data and it was last month’s CPI release that helped to establish current lows in stocks. The NFP report on Friday was strong and keeps the Fed on a hawkish path. Will CPI produce another bullish response for equities as we saw last month or will this be the kindling that bears have been looking for to take out the lows?
- The analysis contained in article relies on price action and chart formations. To learn more about price action or chart patterns, check out our DailyFX Education section.

Markets do not move in straight lines, and trends aren’t usually linear. Sentiment plays a huge role because if most parties that want to be short (or long), already are – well then who is left on the sidelines that can push price in that trend-side direction?
This seems to explain US equities so far in 2022. While bearish trends took-hold in Q1, breakouts haven’t been the most fruitful path forward. This is evidenced by the response to breakouts in January, February, June and again last month. In each instance, sellers push down to a fresh lower-low and shortly thereafter, the bearish pressure recedes and price then moves into rally mode.
When this happened in June, just after the FOMC rate decision that saw the bank start hiking by 75 basis points, price in the S&P 500 went on to rally for two months after, gaining 19% along the way. Of course this door was slammed shut later in August at the Jackson Hole Economic Symposium when Chair Powell took a more-focused approach towards warning of rate hikes and tighter policy on the way.
On the below chart, I’ve identified four of these scenarios that have shown so far this year. This highlights the danger of selling at or near lows, even with a strong bearish trend that’s been in-place for much of this year.
S&P 500 Daily Price Chart
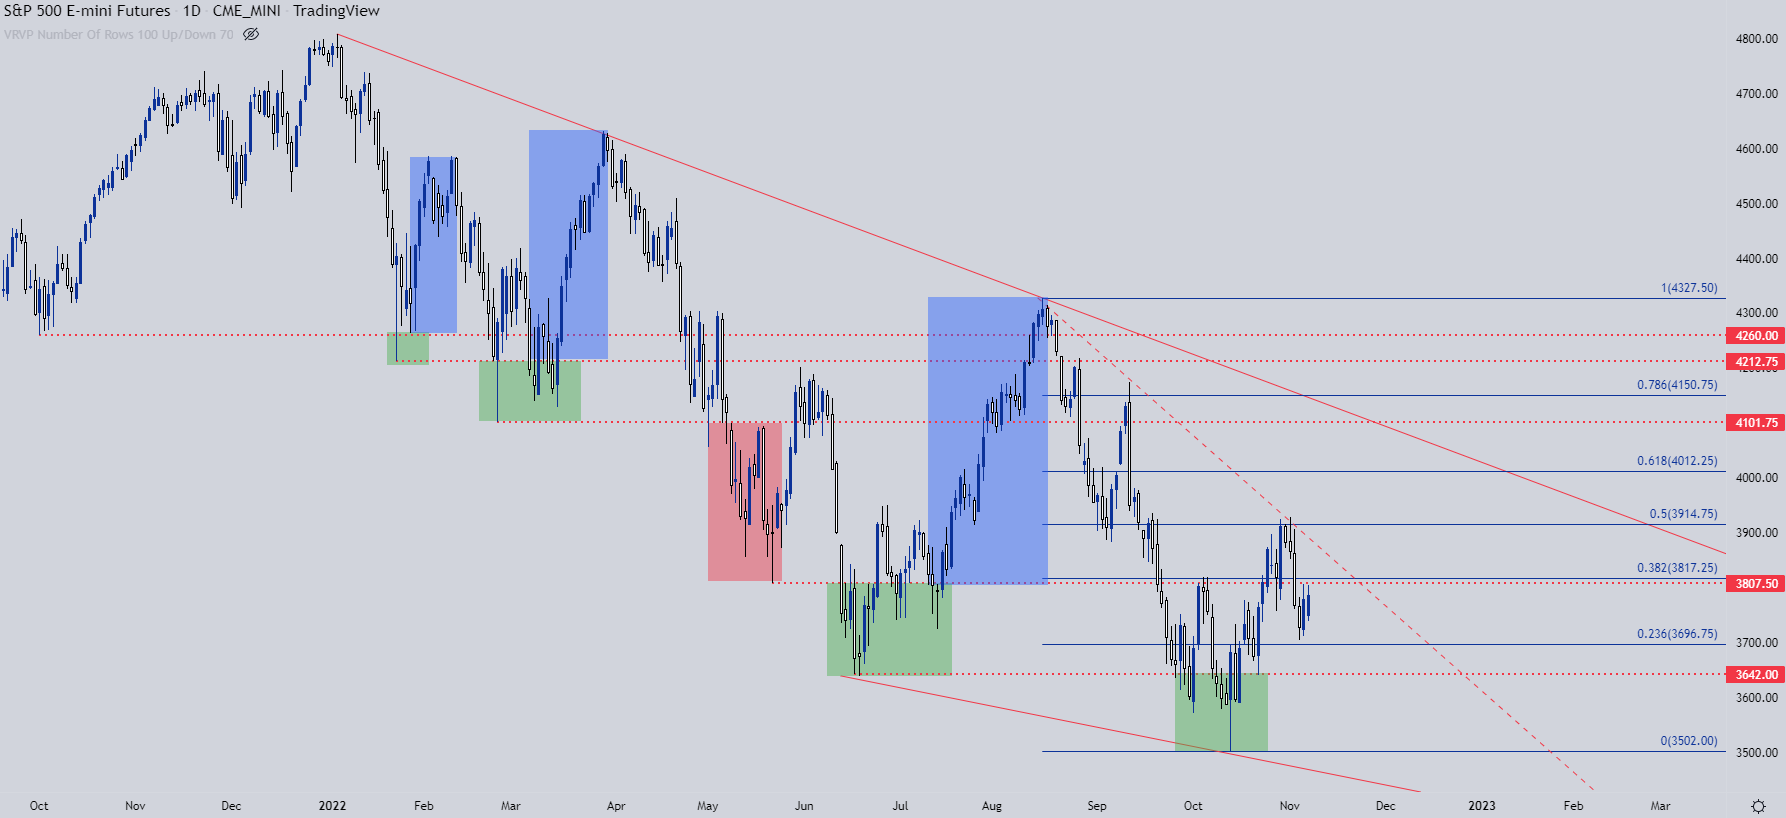
Chart prepared by James Stanley; S&P 500 on Tradingview
S&P 500 Breaks Rising Wedge, Pulls Back to Key Zone
The S&P 500 had a bearish reversal formation set up ahead of last week’s FOMC rate decision. That rising wedge formation filled in last Wednesday and had continuation through Friday trade.
Friday morning, however, brought a quick run up to test resistance at a key spot, the same 3802-3820 zone that’s been in-play in various ways since May. That level helped to hold the highs at the open but sellers couldn’t break through support – which led to a late week bounce with that same zone in-play this morning as we open a fresh week.
S&P 500 Four Hour Price Chart
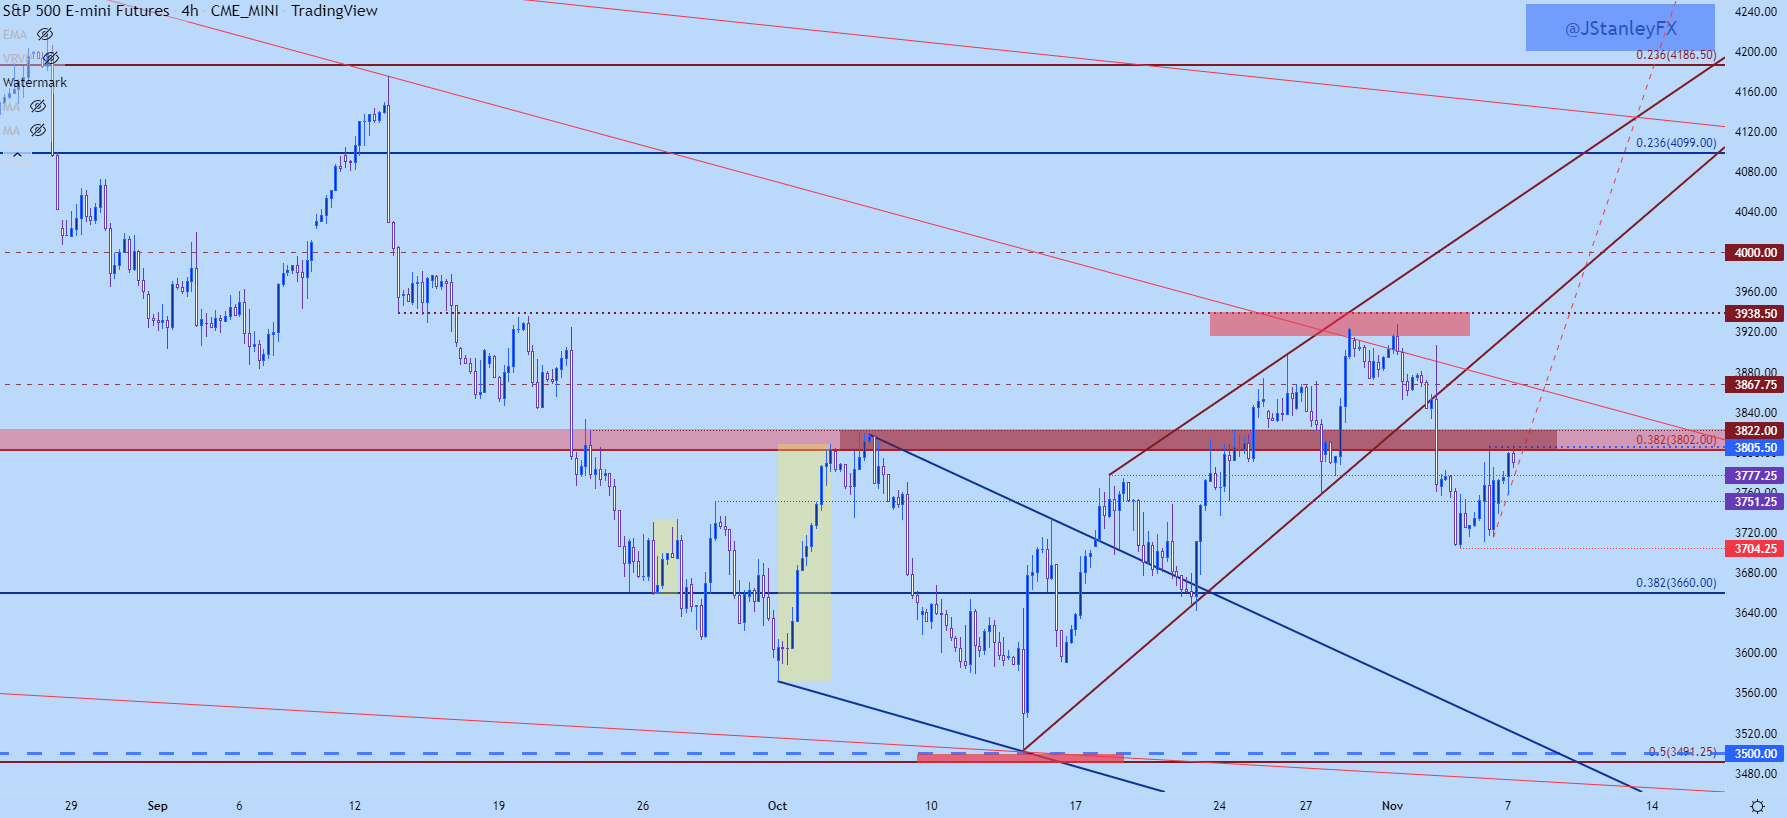
Chart prepared by James Stanley; S&P 500 on Tradingview
The price of 3802 is taken from a key Fibonacci level, as the 38.2% retracement of the pandemic major move. And from a very short-term basis, there’s breakout potential there this morning, when coupling that second resistance test with a series of quick higher-lows.
Beyond 3802, 3820 comes into the picture, after which 3850 and 3867 present some resistance potential. Above that, it’s the 3900 zone that looms large, and this was the same that caught the highs for the index during FOMC last week.
On the underside of price action, support potential remains at 3777 and if sellers can push through that, we have a breach of the bullish trendline and negation of a possible ascending triangle. The level of 3750 comes into play after that, with 3704 below that.
S&P 500 Hourly Price Chart
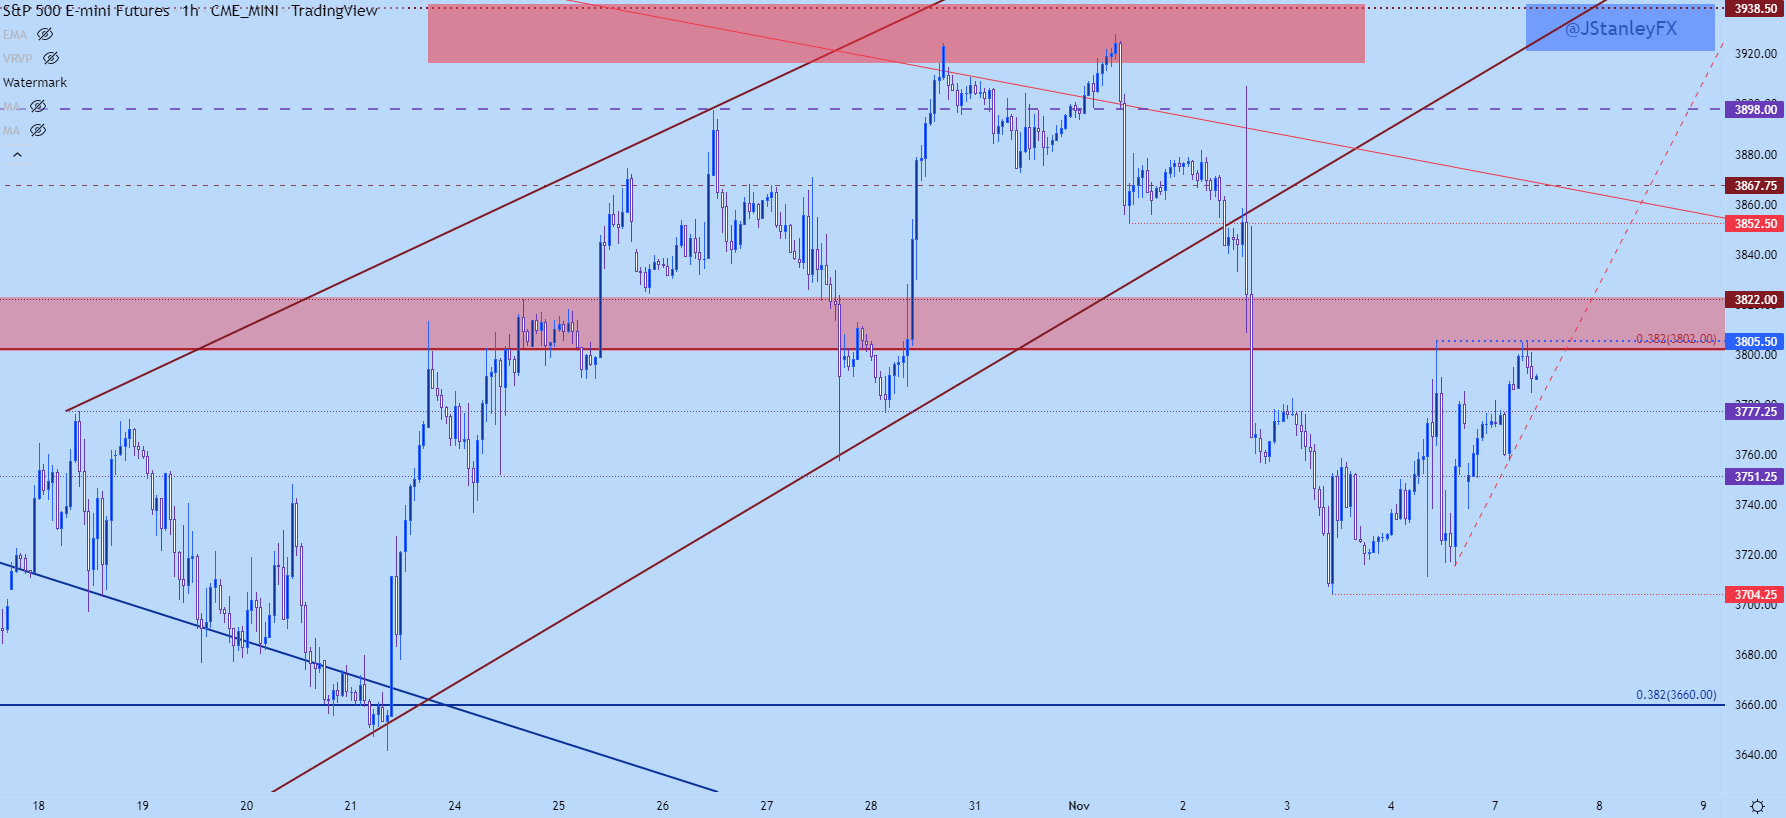
Chart prepared by James Stanley; S&P 500 on Tradingview
Nasdaq Has Been Weaker
When compared to the S&P 500 of late, the Nasdaq has been weaker, and given the focus on rates this makes sense as the tech-heavy Nasdaq can be thought of as more rate-sensitive. And as a comparison, eve as the S&P 500 remained well-above the October low around 3500 last week, with support showing more than 200 points higher, the Nasdaq came in to test a major zone of support and came very close to testing through that recent yearly low. Even the Friday bounce was a bit lighter and on the below chart, we can see how nearby price remains to that key spot on the chart.
I’m plotting this between Fibonacci levels at 10,501 and 10,751, the former of which was my first target in the Q4 Top Trades installment.

Nasdaq Weekly Price Chart
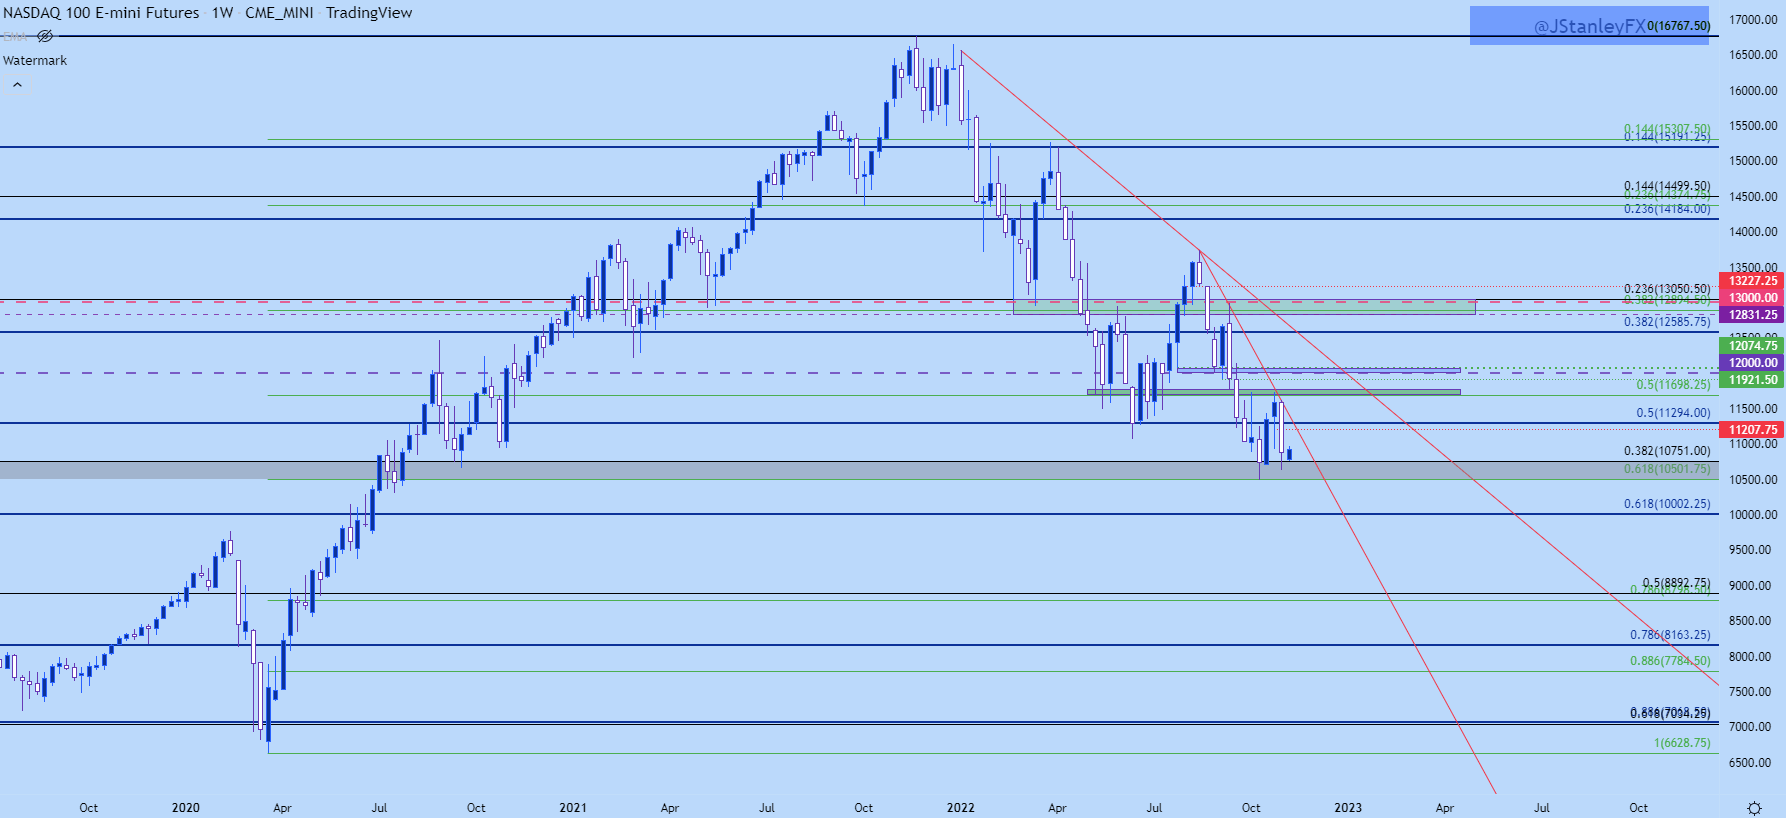
Chart prepared by James Stanley; Nasdaq 100 on Tradingview
Nasdaq Shorter-Term
From a shorter-term basis, there’s been a similar setting of resistance as what’s looked at above with focus on the 11k area.
This also presents bullish breakout potential but given the divergence on longer-term time frames, this might be a scenario more interesting for bears, looking for a breakout into a longer-term lower-high. Above 11k, there’s resistance potential around 11,062 and then 11,185-11,207 and 11,294.
On the underside of price action, a breach of 10,817 indicates failure from bulls and then puts focus back on the Fibonacci level at 10,751, after which the low comes into view at 10,667 after which 10,501 comes into play.
Nasdaq Two-Hour Price Chart
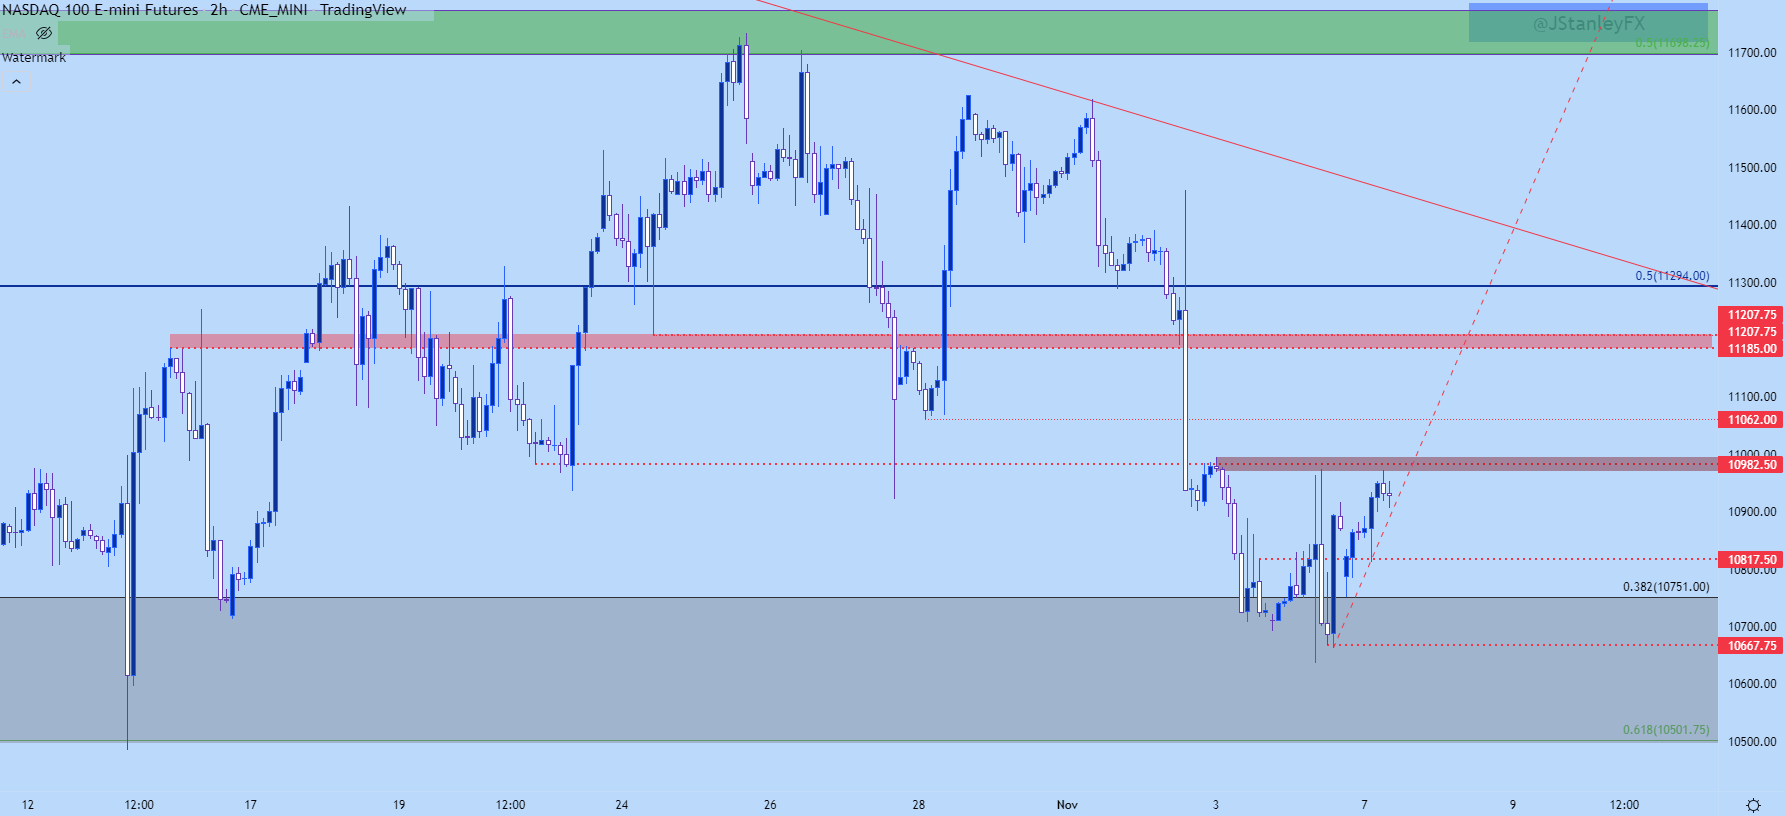
Chart prepared by James Stanley; Nasdaq 100 on Tradingview
Dow Leads the Way
I looked at this last week but the divergence between the Dow and the Nasdaq is difficult to ignore. And again, given dynamics in interest rates it makes sense as to why we’d see such a scenario. But, this also highlights strategy potential, where bullish equity approaches may be better focused on the high performer in this backdrop versus the laggard of the Nasdaq. And, if looking for weakness, the opposite is true, with bearish approaches focusing on the more vulnerable tech stocks.
Last week’s support in the Dow showed up at a key area, around the 38.2% Fibonacci retracement from this year’s major move, which was confluent with a prior price actions wing in the 31,900 area. I had highlighted this zone in yellow yesterday and it remains on the below chart. Price is now making a fast approach towards the 50% marker of that same major move, which had helped to set resistance last week before the FOMC-fueled pullback.
Dow Jones Daily Chart
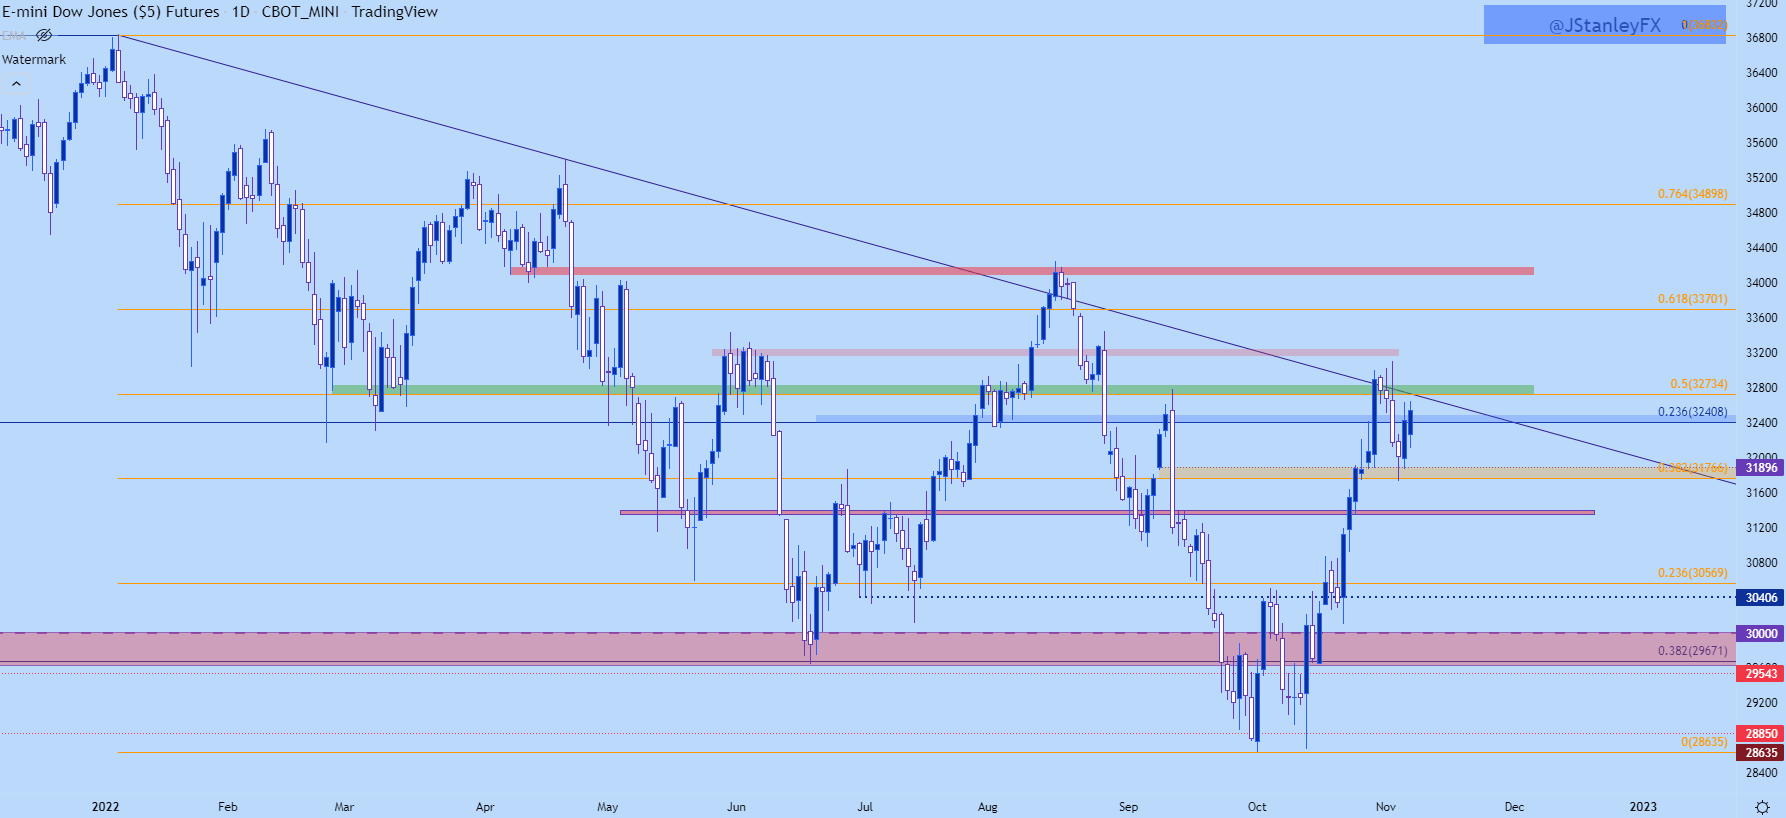
Chart prepared by James Stanley; Dow Jones on Tradingview
Dow Shorter-Term: Overhead Resistance
One difference on a shorter-term basis between the two above setups and what’s showing in the Dow: Proximity to last week’s highs. While the S&P and Nasdaq are both well-below last week’s high, the same can’t be said of the Dow and that zone of resistance currently sits overhead, around that 50% retracement looked at above.
This provides an area of possible turbulence for bullish approaches. The 50% marker plots at 32,734 after which last week’s high shows around 33k-33,100. A break-beyond that price spells a fresh two-month-high, which would be the highest level in the index since the August 26th speech from Jerome Powell.

Dow Jones Four-Hour Price Chart
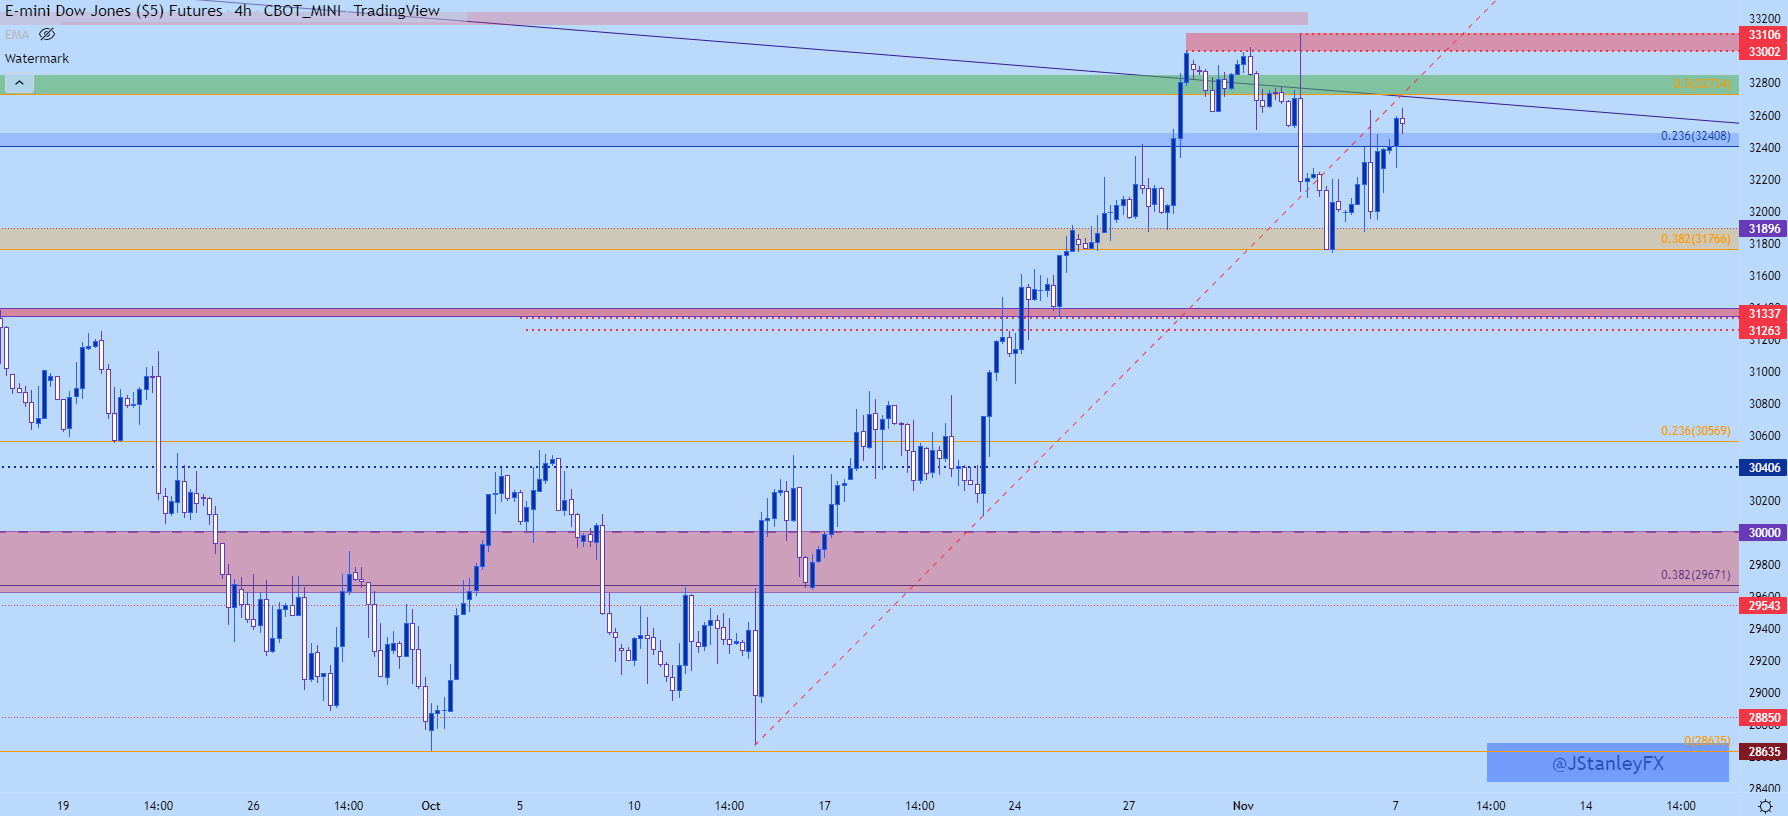
Chart prepared by James Stanley; Dow Jones on Tradingview
--- Written by James Stanley, Senior Strategist, DailyFX.com & Head of DailyFX Education
Contact and follow James on Twitter: @JStanleyFX


