


Singapore Dollar, USD/SGD, AUD/SGD, NZD/SGD, SGD/CNH - Technical Outlook:
- USD/SGD faces tough resistance at the 2020 high
- AUD/SGD drifts lower in a range
- NZD/SGD looks set to achieve its head & shoulders target
- Chance of a minor retreat in SGD/CNH

USD/SGD TECHNICAL FORECAST - BULLISH
The Singapore Dollar could weaken against the US Dollar but seems to be well positioned to strengthen further against some of its regional peers.
USD/SGD last week broke above the upper edge of a rising channel (that came at about 1.4120), opening way initially towards the April 2020 high of 1.4415, with strong resistance at the 2020 high of 1.4646, near the top edge of a long-term, slightly upward-sloping channel from 2016. A breakout from a consolidation pattern signals an acceleration in the trend towards the measured target, often the width of the pattern. The channel width points to a move towards 1.4600.
However, a negative divergence (rising price associated with weakening momentum) on the 60-minute chart suggests USD/SGD may consolidate a bit in the near term before resuming its uptrend. There is initial support at Monday’s low of 1.4290 and stronger support at the September 22 high of 1.4200. USD/SGD would need to fall below the July high of 1.4100 for the upward pressure to fade.

USD/SGD Weekly Chart
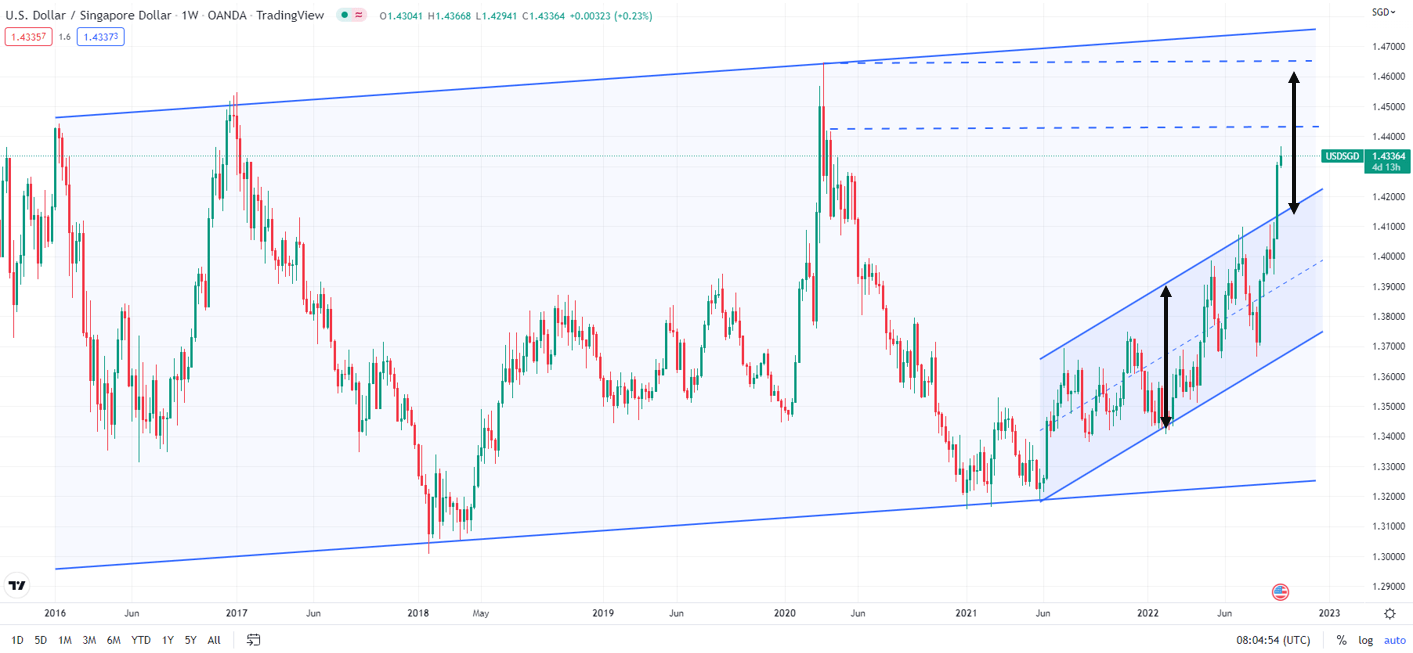
Chart Created Using TradingView
AUD/SGD TECHNICAL FORECAST – BEARISH
AUD/SGD has been relatively stable, drifting lower in a range over the past two years. The lower edge of the slightly declining channel since 2021 now comes in at about 0.9265, while the upper edge is a downward-sloping trendline, now at about 1.0050.
AUD/SGD is now testing the lower edge of the channel. A decisive break below could pave the way towards 0.8965 (the 61.8% retracement of the 2020-2021 rally). The trajectory of the channel would point to a drop towards 0.8300 though the breakout is not a done deal. On the upside, AUD/SGD faces stiff resistance at the January low of 0.9450. Unless this resistance is broken, the bias remains down for AUD/SGD.
AUD/SGD Weekly Chart
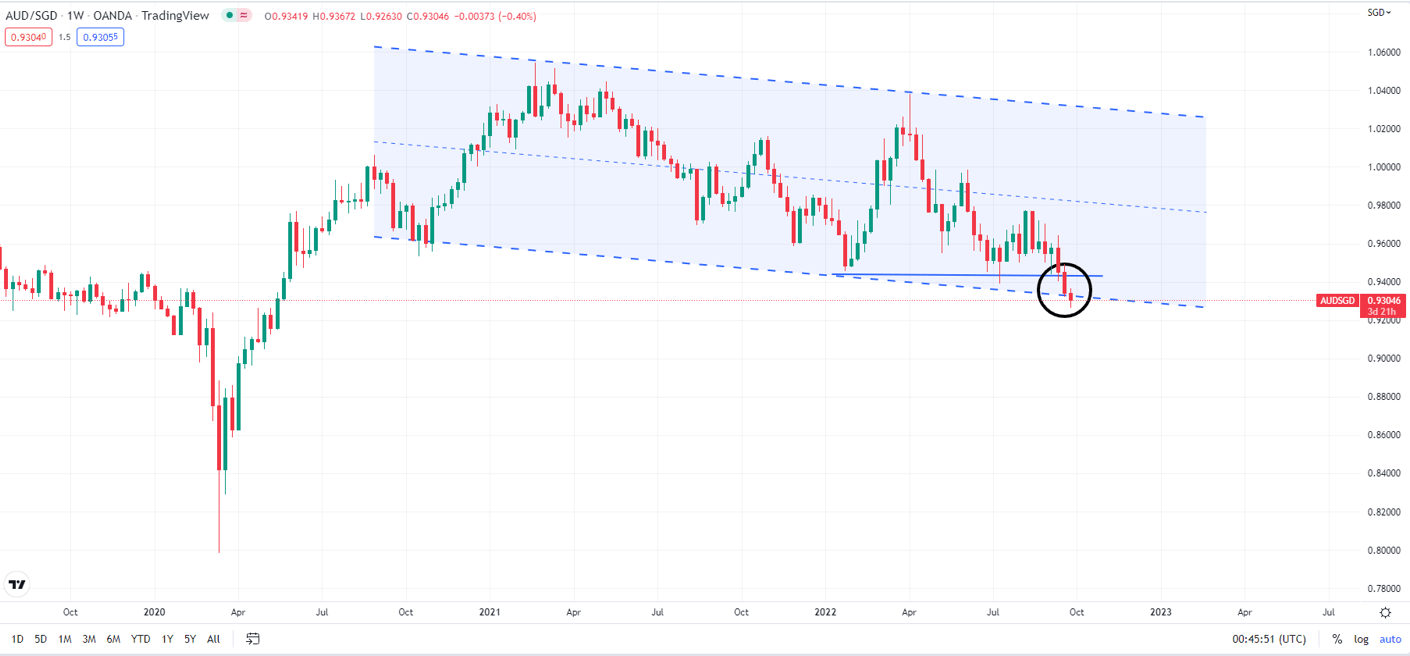
Chart Created Using TradingView
NZD/SGD TECHNICAL FORECAST – BEARISH
NZD/SGD looks set to retest the 2020 low of 0.7924. This follows a break earlier this month below support at the July low of 0.8510. Earlier in 2022, the cross fell below crucial horizontal trendline resistance at 0.8850, triggering a major head & shoulders-type topping pattern (the left shoulder at the July 2020 high, the head at the 2021 highs, the right shoulder at the July 2022 high), pointing to a fall towards the 2020 low of 0.7924.
On the upside, NZD/SGD faces initial resistance on the 10-day moving average (now at about 0.8280), followed by Monday’s high of 0.8250. For the medium-term bearish outlook to fade, NZD/SGD would, at minimum, rise above tough resistance at the July low of 0.8510.
NZD/SGD Weekly Chart
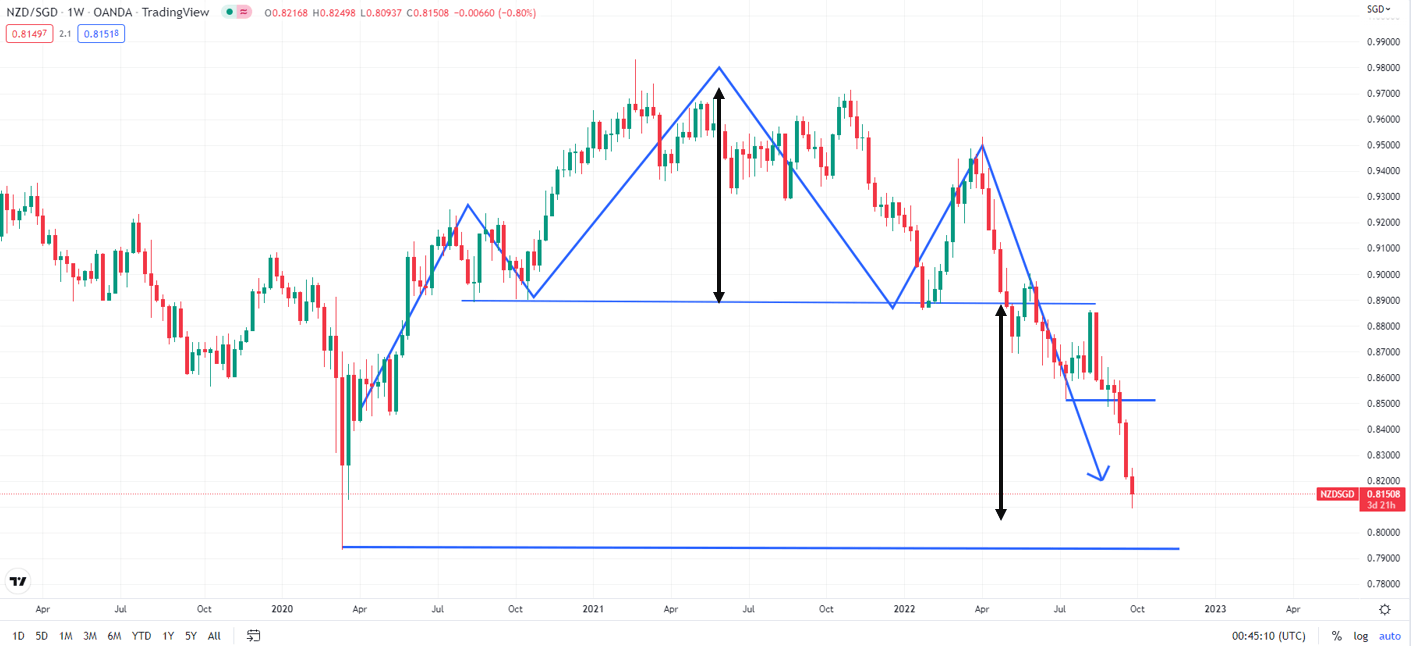
Chart Created Using TradingView
SGD/CNH TECHNICAL FORECAST – NEUTRAL
Negative divergence on the daily and the weekly charts, just as SGD/CNH approaches key support, suggests the six-month rally appears to be losing steam. A short-term retreat can’t be ruled out.
SGD/CNH is approaching resistance on the median line of a rising channel from 2018 (see chart). While the cross is at a new multi-week high, the 14-week Relative Strength Index (RSI) is around its mid-2022 highs (that is, it hasn’t made a meaningful new high). The loss of momentum as the price continues to fall is often a warning sign for a short-term retracement.
Any break below the May high of 4.9415, coinciding with the 200-week moving average, would indicate that the upward pressure had faded for now, pointing to some consolidation in the short term. The medium-term uptrend is unlikely to reverse while the cross holds above the 200-day moving average (now at 4.80).

SGD/CNH Weekly Chart
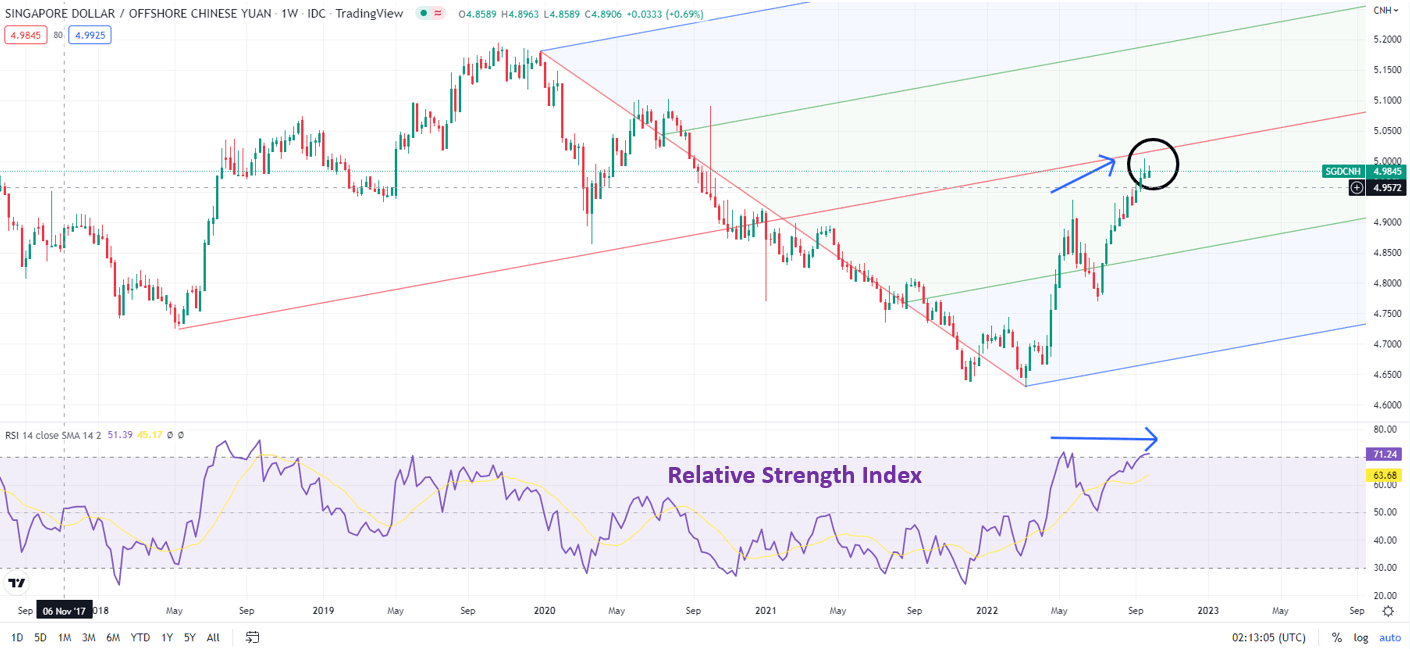
Chart Created Using TradingView
--- Written by Manish Jaradi, Strategist for DailyFX.com


