


SGD, Singapore dollar, USD/SGD, AUD/SGD, NZD/SGD - Technical Outlook:
- USD/SGD could be falling back into a range.
- AUD/SGD and NZD/SGD are testing key support levels.
- What is the outlook and what are the key levels to watch?

USD/SGD SHORT-TERM TECHNICAL FORECAST - NEUTRAL
Friday’s drop in USD/SGD after the Singapore central bank tightened monetary policy reaffirms that the upward pressure is fading, but it may not be sufficient to conclude that the uptrend has terminated.
The Monetary Authority of Singapore (MAS) tightened policy for the fifth time in a year in a bid to curb inflation running at a 14-year high, and that left the door open to further policy action. USD/SGD fell sharply following the announcement.
USD/SGD 4-Hourly Chart
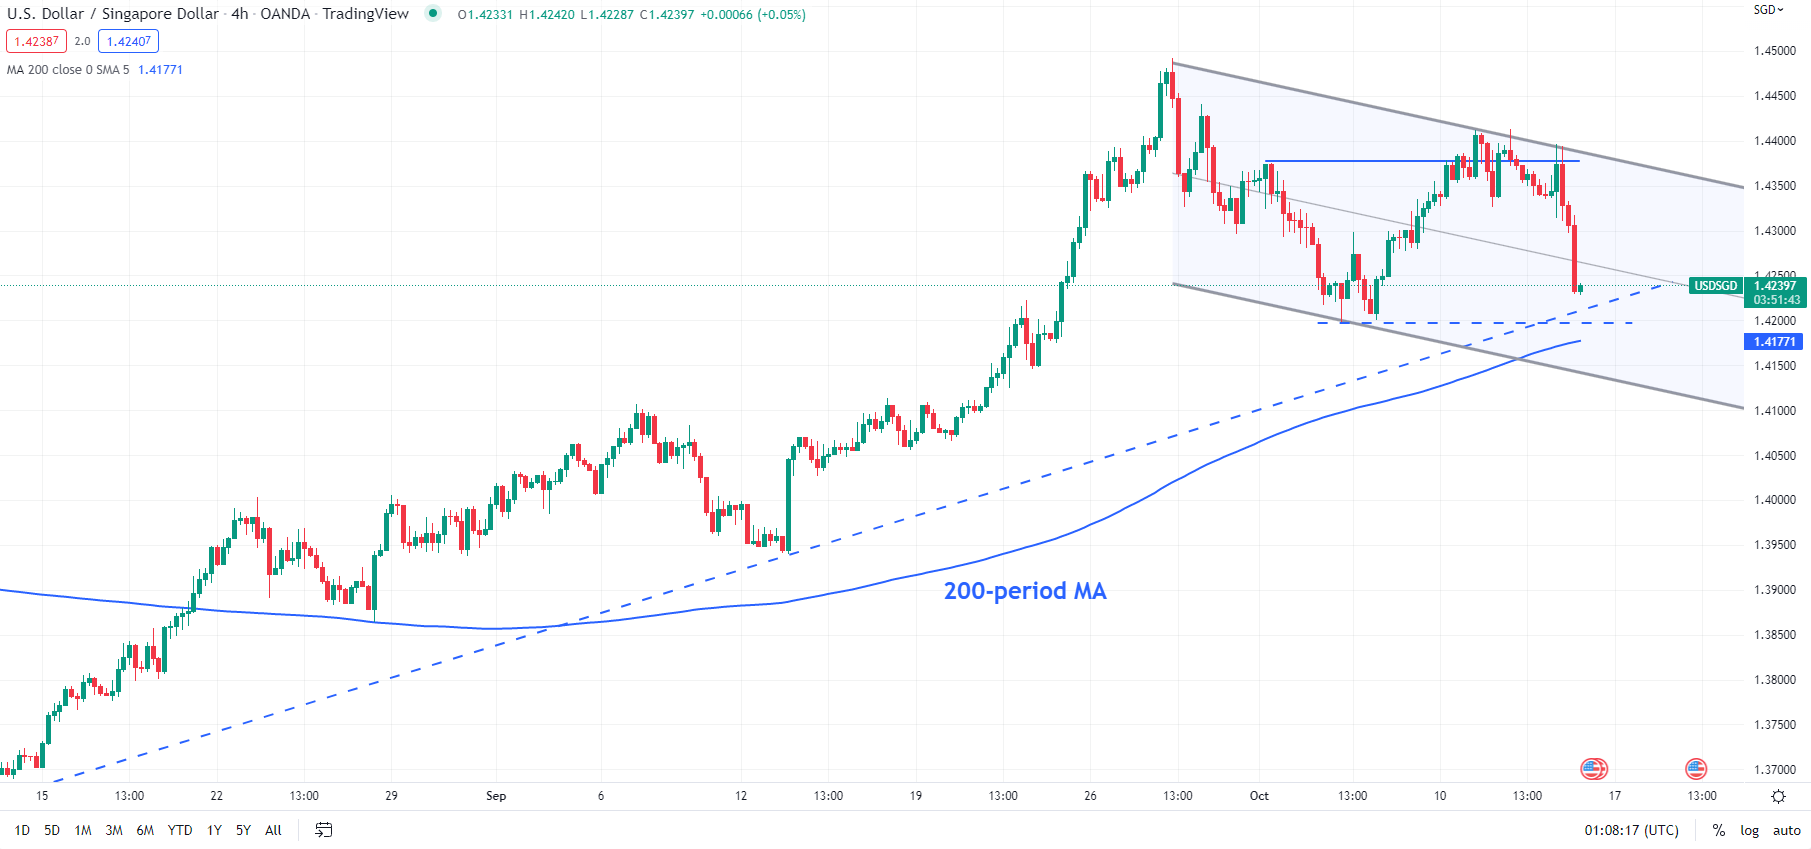
Chart Created Using TradingView
On technical charts, USD/SGD in recent days has struggled to clear a tough hurdle at the October 3 high of 1.4375. The break this morning below immediate support at Wednesday’s low of 1.4323 confirmed that the short-term upward pressure has eased.
However, USD/SGD continues to hold above fairly strong converged support at 1.4135-1.4195 (includes the October 5 low of 1.4194, an uptrend line from August and the lower edge of a falling channel from end September). The medium-term upward pressure is unlikely to ease while 1.4135-1.4195 remains intact. On the upside, USD/SGD needs to rise above Tuesday’s high of 1.4411 to resume its uptrend. For a reversal of the broader uptrend, USD/SGD needs to fall below the 200-day moving average (now at about 1.3800).

AUD/SGD MEDIUM-TERM TECHNICAL FORECAST – BEARISH
AUD/SGD’s break last month below a slightly downward-sloping trendline from October has triggered a topping formation like a head & shoulders, pointing to further weakness over the medium term. The price objective of the pattern works out to about 0.8550, but like with all patterns, the price objective tends to be a guide and not a rule.
AUD/SGD Weekly Chart
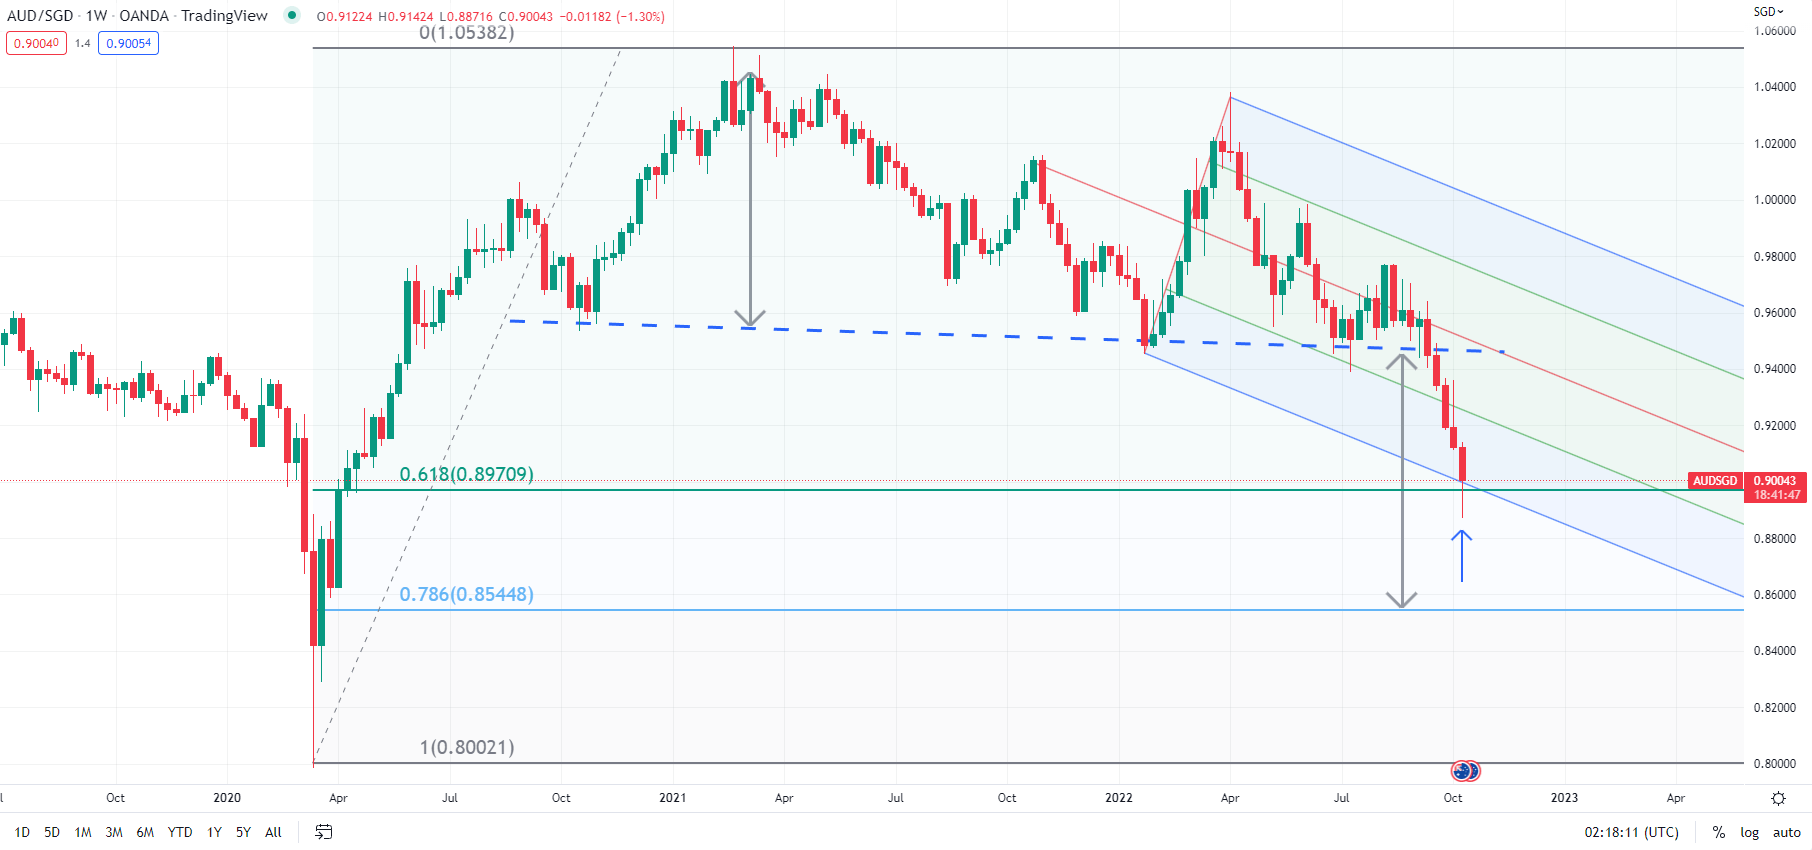
Chart Created Using TradingView
Meanwhile, oversold conditions point to the possibility of some consolidation/minor rebound in the near term, especially as AUD/SGD tests converged support on the lower edge of a declining channel from 2021, coinciding with the 61.8% retracement of the 2020-2021 rise (see chart). Any rebound could be short lived given initial resistance on an internal downtrend line within the channel (now at about 0.9230), followed by stronger resistance at the January low of 0.9456.

NZD/SGD SHORT-TERM TECHNICAL FORECAST – NEUTRAL
NZD/SGD’s drop to a 31-month low in October has meant that the price objective of the head & shoulders pattern has been achieved (see chart). At the same time, the cross is now testing strong support at the March 2020 low of 0.7925.
NZD/SGD Weekly Chart
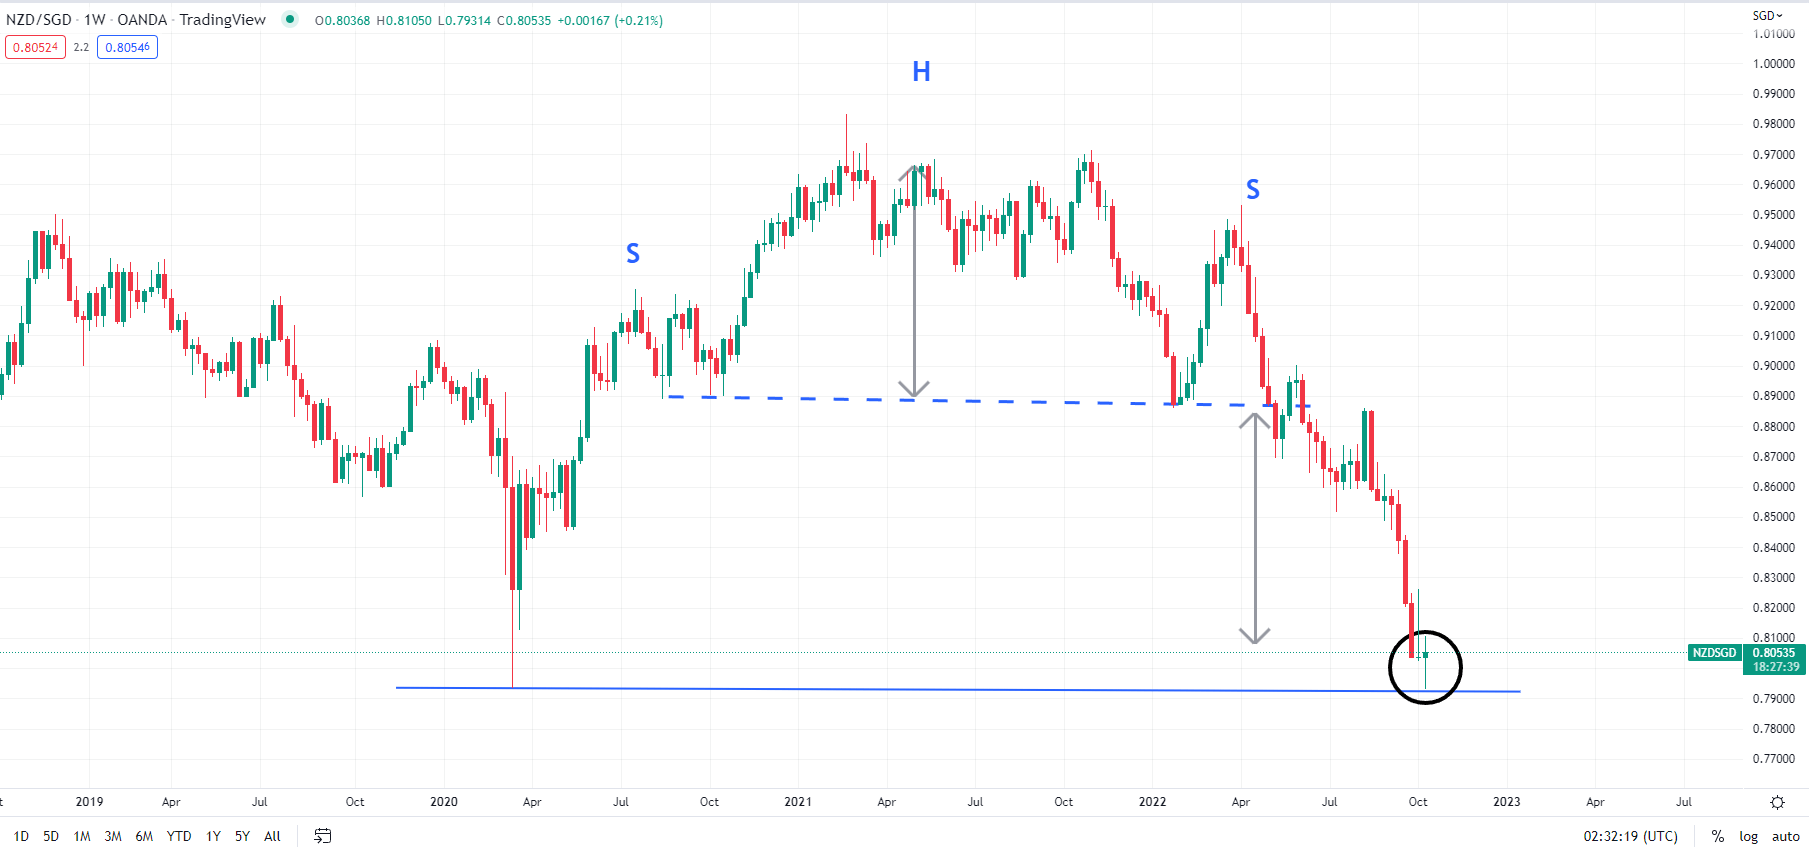
Chart Created Using TradingView
Despite the support, the overall trend bias remains down, especially given there is no sign of reversal yet. However, given the pace and extent of the recent fall coupled with oversold conditions, a minor rebound is possible. Any break above initial resistance at last week’s high of 0.8260 would indicate that the downward pressure had eased for now, pointing the possibility of a range developing in the short term. For the medium-term downward pressure to fade, NZD/SGD would need to rise above the 200-day moving average (now at about 0.8850).
--- Written by Manish Jaradi, Strategist for DailyFX.com


