


S&P 500, SPX, NASDAQ 100, NDX - TECHNICAL OUTLOOK:
- The S&P 500 index is approaching crucial 200-day moving average resistance.
- Nasdaq, a laggard compared with the S&P 500, is also beginning to flex muscles.
- What lies ahead and what are the key levels to watch?

S&P 500 INDEX SHORT-TERM TECHNICAL OUTLOOK – SLIGHTLY BULLISH
In a holiday-shortened week, the S&P 500 is at a crucial crossroads, a break above which could increase the chances that the medium-term weakness in US equities is beginning to reverse.
The index is testing a ceiling on the 200-day moving average (now at about 4060). Two major attempts this year to cross above the long-term barrier have been unsuccessful. Hence, a clearance above it would solidify the case that this time is different. That is, the rebound may not just be a correction, but could unfold into a larger rally.
S&P 500 Daily Chart

Chart Created Using TradingView
The chances of an eventual break above the moving average are growing, even if it doesn’t happen in its first attempt. The index held quite a strong cushion at the early-November high of 3912 earlier in the week – a break below that would have been a serious blow to the nascent rally. Furthermore, momentum continues to favor further upside. Importantly, positive divergence (falling index associated with rising momentum) on the monthly charts coupled with a rise this month above October’s high is a sign that the tide could be changing.
S&P 500 Hourly Chart
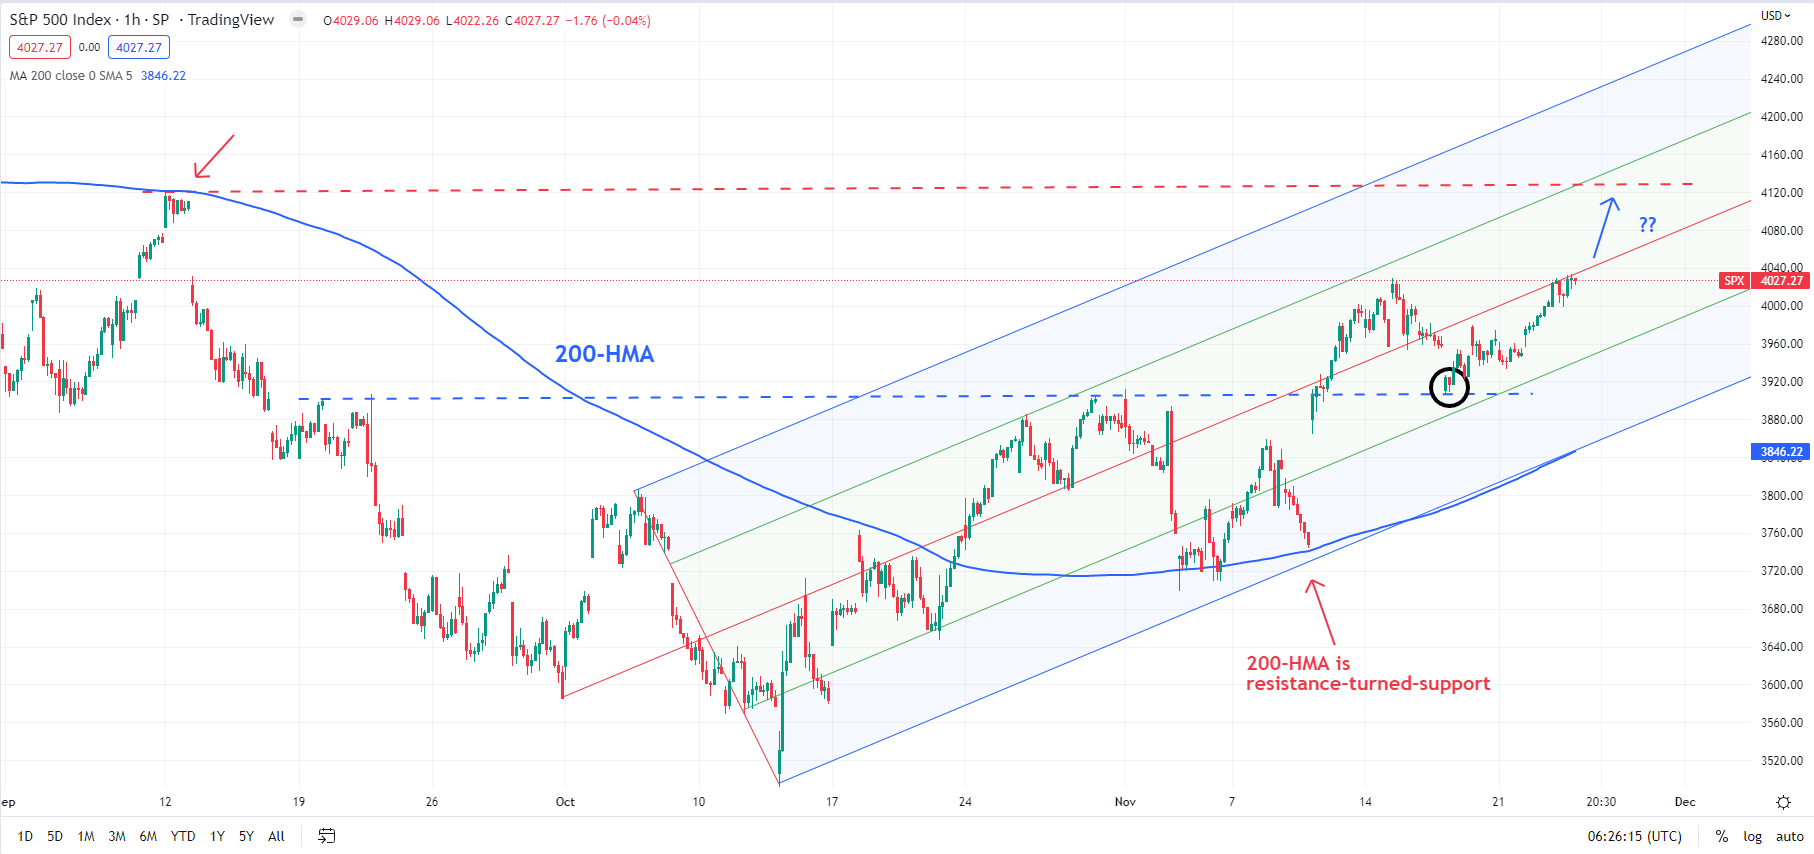
Chart Created Using TradingView
How lasting this rebound turns out to be remains a question. In this regard, the August high of 4325 is a key barrier to watch. The index needs to cross above this hurdle to solidify the chances that the worst is over for US equities.
On the downside, 3912 remains immediate and vital support. Any break below would confirm that the short-term uptrend has faded. Moreover, a fall under the floor at the November 3 low of 3698 would raise the odds that medium-term weakness is resuming.
NASDAQ COMPOSITE INDEX SHORT-TERM TECHNICAL OUTLOOK – SLIGHTLY BULLISH
After an initial setback, the Nasdaq 100 index is yet again attempting to rise past the upper edge of a rising channel from mid-October. As highlighted in the previous update earlier in the week, the bias continues to be bullish. Positive divergence on the weekly charts of the Nasdaq 100 index at the October low confirms that the multi-month slide has lost steam.
NASDAQ COMPOSITE Hourly Chart
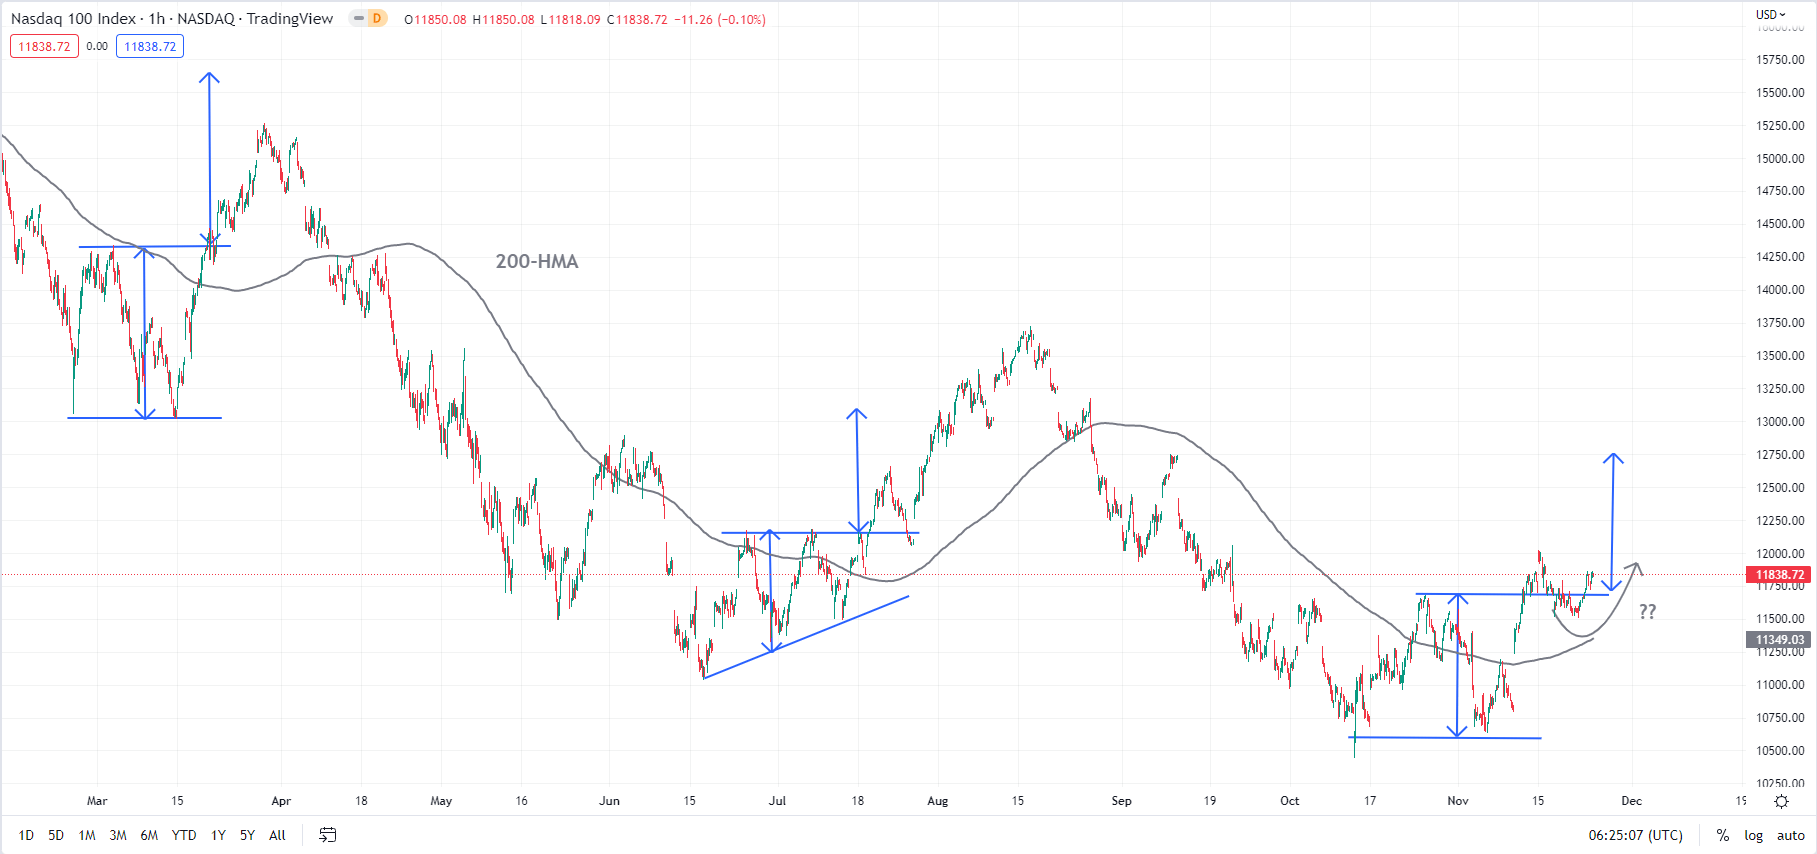
Chart Created Using TradingView
The odds are high that the index could rise toward the 200-day moving average (now at about 12610), not too far from the price objective of the minor double bottom (the October and the November lows) of 12750. The last time the index was decisively above the long-term moving average was in January. Hence a cross-over of the average would be a sign that medium-term downward pressure was fading. Still, the August high of 13721 would pose a significant threat to a lasting recovery.

--- Written by Manish Jaradi, Strategist for DailyFX.com


