


Palladium, Ascending Triangle, 2020 Lows – Technical Update:
- Palladium prices could be heading for a third weekly loss
- Daily chart shows next critical support around 2020 lows
- Ascending Triangle breakout on 4-hour setting spells trouble
Trade Smarter - Sign up for the DailyFX Newsletter
Receive timely and compelling market commentary from the DailyFX team
Weekly Chart – 2020 Lows in Focus?
Palladium prices are heading for a third consecutive weekly losing streak, with the rare metal down about 0.7% so far. Last week, prices confirmed a breakout under the 2021 low at 1531, exposing the 2020 bottom at 1355. Broadly speaking, palladium has been aiming lower since finding a top in March 2022 at 3425. Since then, a falling trendline from then has been guiding prices lower, maintaining the dominant downside focus.
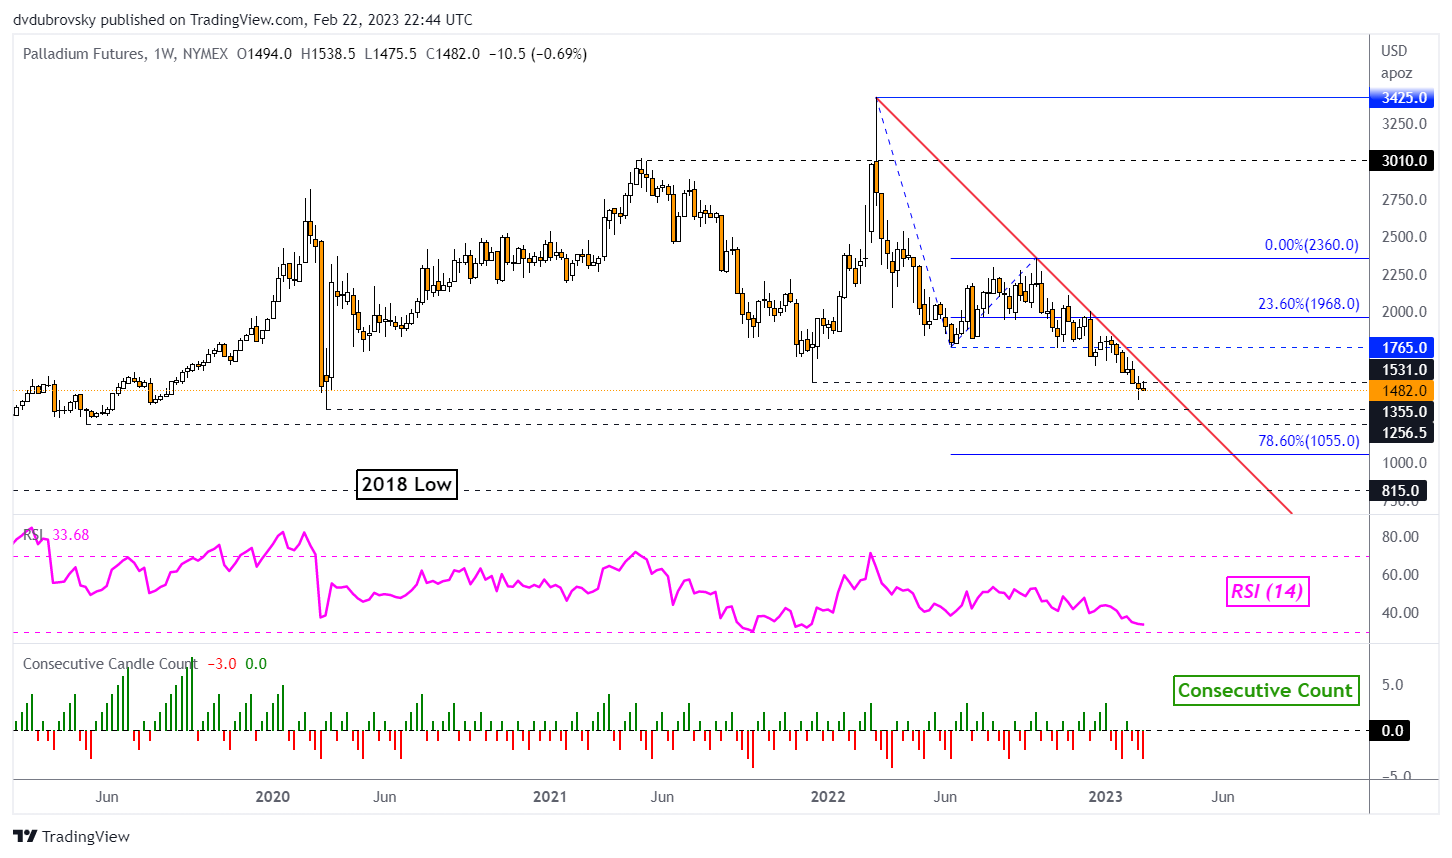
Chart Created Using TradingView
Daily Chart – Bearish Bias Remains
Zooming in on the daily chart, the rare metal has been consolidating between resistance at 1531 and support (1355310 – 1410.80). The latter zone makes up lows from 2020. Palladium also remains below the 2022 falling trendline. As such, there is room for a near-term rally without necessarily overturning the broader downside bias. Even so, an upside breakout would place the focus on the 100-day Simple Moving Average (SMA). The latter may hold as key resistance.
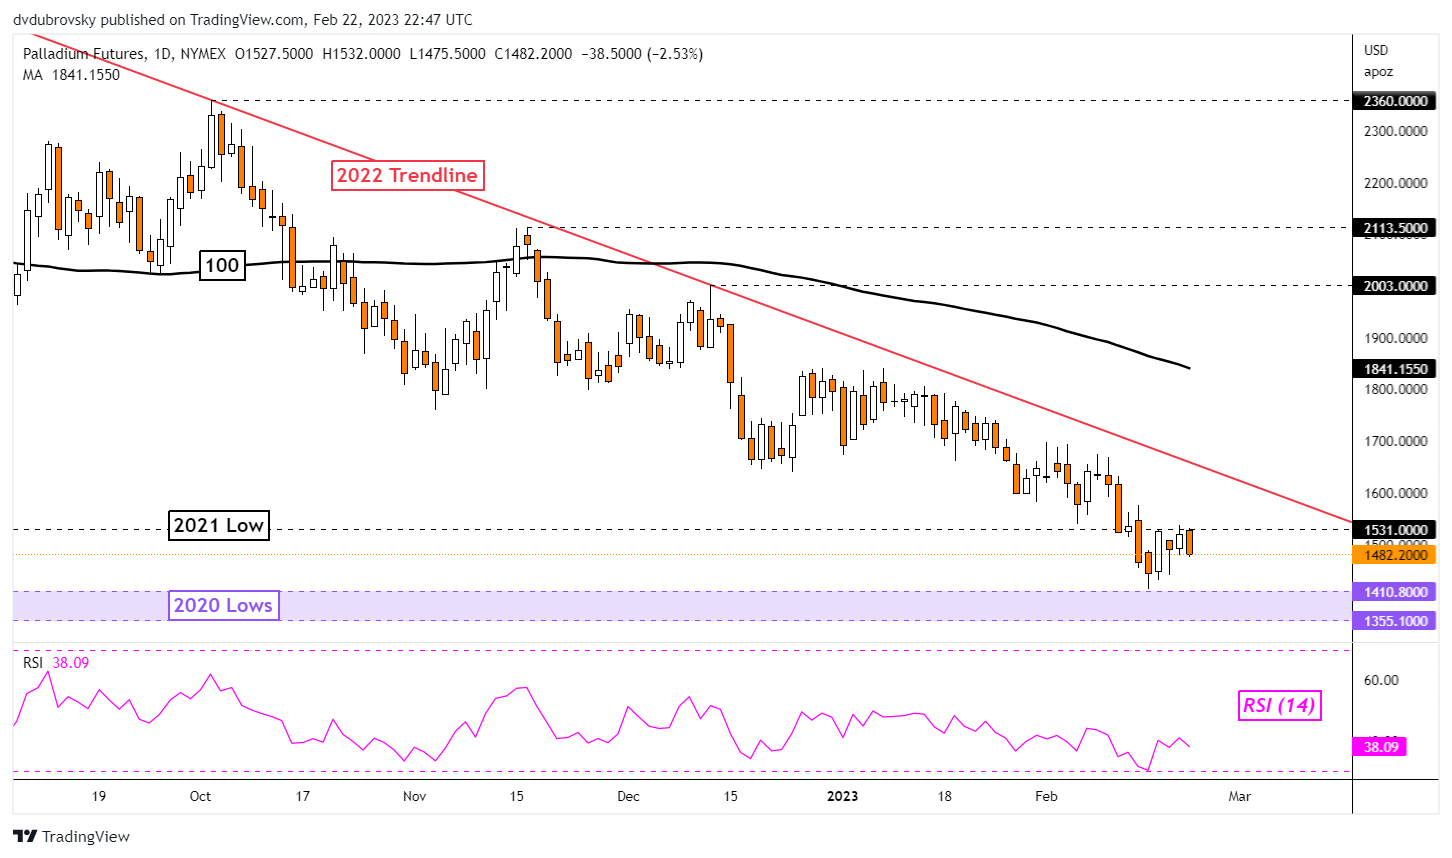
Chart Created Using TradingView
4-Hour Chart – Ascending Triangle Breakout Hints More Losses May Come
Zooming in further on the 4-hour chart reveals an increasingly bearish perspective. Palladium has broken under an Ascending Triangle chart formation. This could open the door to resuming losses that accelerated at the beginning of February. Immediate support is the 23.6% Fibonacci extension level at 1462.5. Breaking lower places the focus on 1413.5.
The potential trajectory of the Ascending Triangle could see prices make their way towards the 61.8% extension level at 1354, which is closely tied with lows from 2020. Otherwise, in the event of a turn higher, the focus will shift towards the ceiling of the chart pattern around 1530. Further breaking above the latter could open the door to revisiting the early February high at 1698.5.

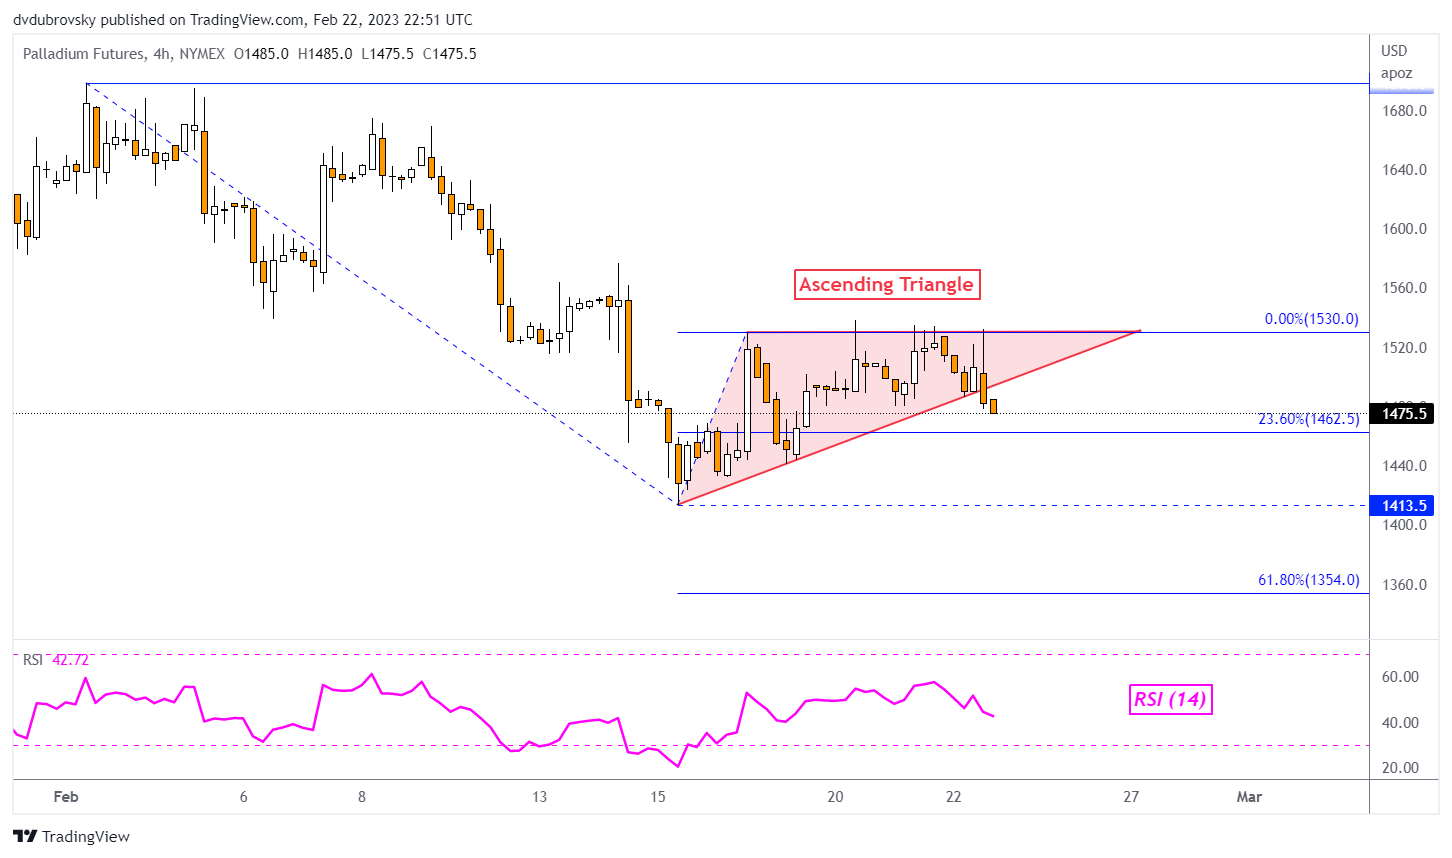
Chart Created Using TradingView
--- Written by Daniel Dubrovsky, Senior Strategist for DailyFX.com
To contact Daniel, follow him on Twitter:@ddubrovskyFX


