


Natural Gas, RSI, Bearish Rectangle – Technical Update:
- Natural gas prices extend decline for a second day
- 20-day SMA could maintain the bearish trajectory
- Eyes remain on a Bearish Rectangle on the 4-hour
Trade Smarter - Sign up for the DailyFX Newsletter
Receive timely and compelling market commentary from the DailyFX team
Daily Chart – 20-day SMA Closing in
Natural gas prices extended losses for a second day as Thursday’s trading session wrapped up. In the near term, the commodity has been consolidating after finding support on the 100% Fibonacci extension level at 2.326. Positive RSI divergence is present, showing that downside momentum is fading. That can at times precede a turn higher.
Now, the 20-day Simple Moving Average (SMA) is closing in from above. The latter has been helping maintain the downside focus since prices closed under it back on December 19th. Thus, it has been almost 2 months since we have last been above this moving average. But, the SMA is closing in. It may reinstate the downside focus, sending prices towards the 114.6% Fibonacci extension at 1.555.
That would also be in line with the broad technical trajectory of a bearish Head and Shoulders chart formation. Reaching the objective would entail extending losses toward 2020 lows, making for a key range of support between 1.44 and 1.612.
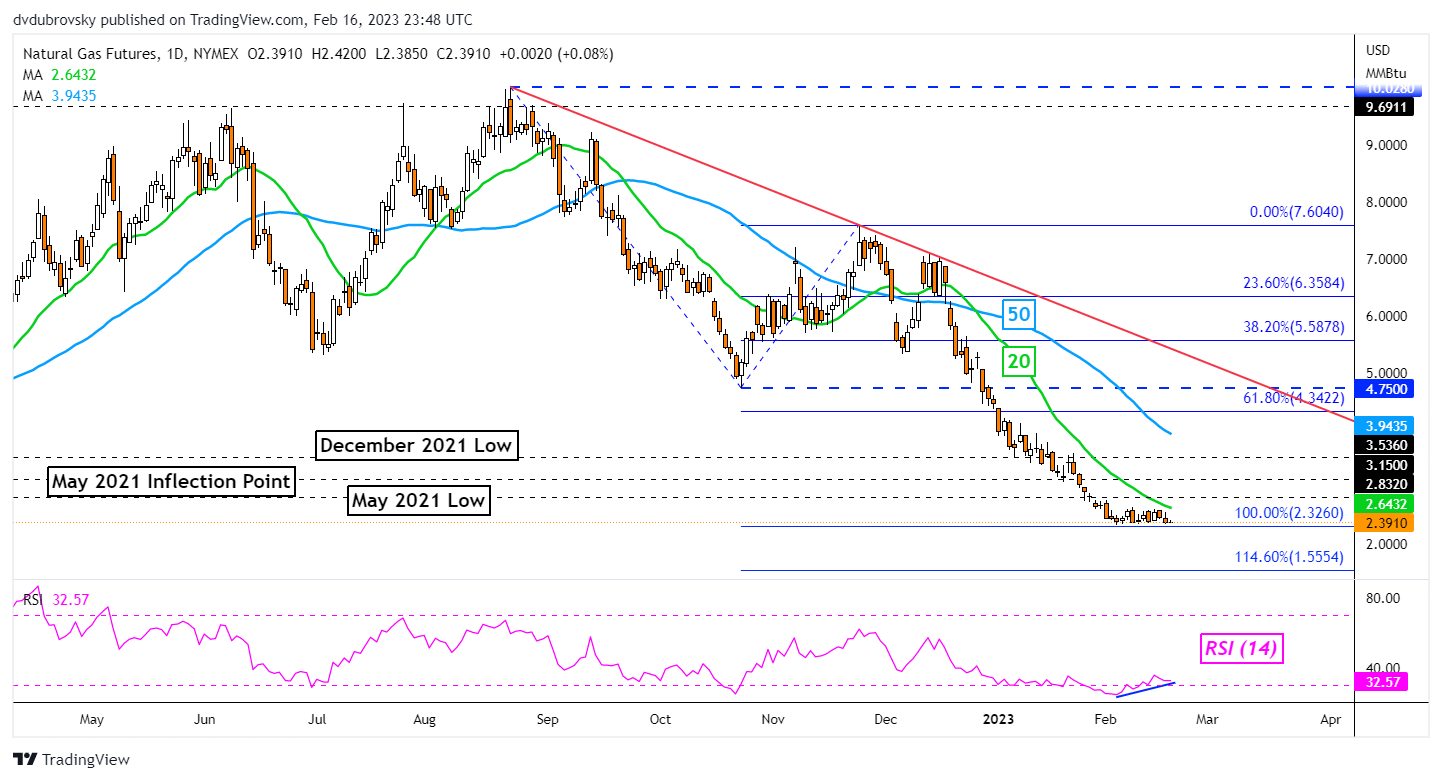
Chart Created Using TradingView
4-Hour Chart – Bearish Rectangle in Focus
Taking a closer look at natural gas prices, on the 4-hour chart, we can see that the commodity continues to consolidate within the boundaries of a Bearish Rectangle chart pattern. Prices recently rejected the ceiling around 2.657, turning lower towards the floor which is at 2.341.
Confirming a breakout under the rectangle may open the door to resuming the near-term downtrend that occurred in late January. However, positive RSI divergence is present, once again showing that downside momentum is fading.
The 100-day SMA is also approaching and may maintain the broader bearish trajectory. Extending losses places the focus on the 138.2% Fibonacci extension level at 2.162. Otherwise, bouncing off the floor of the rectangle opens the door to revisiting the ceiling. Clearing higher would expose the 61.8% point at 2.954.

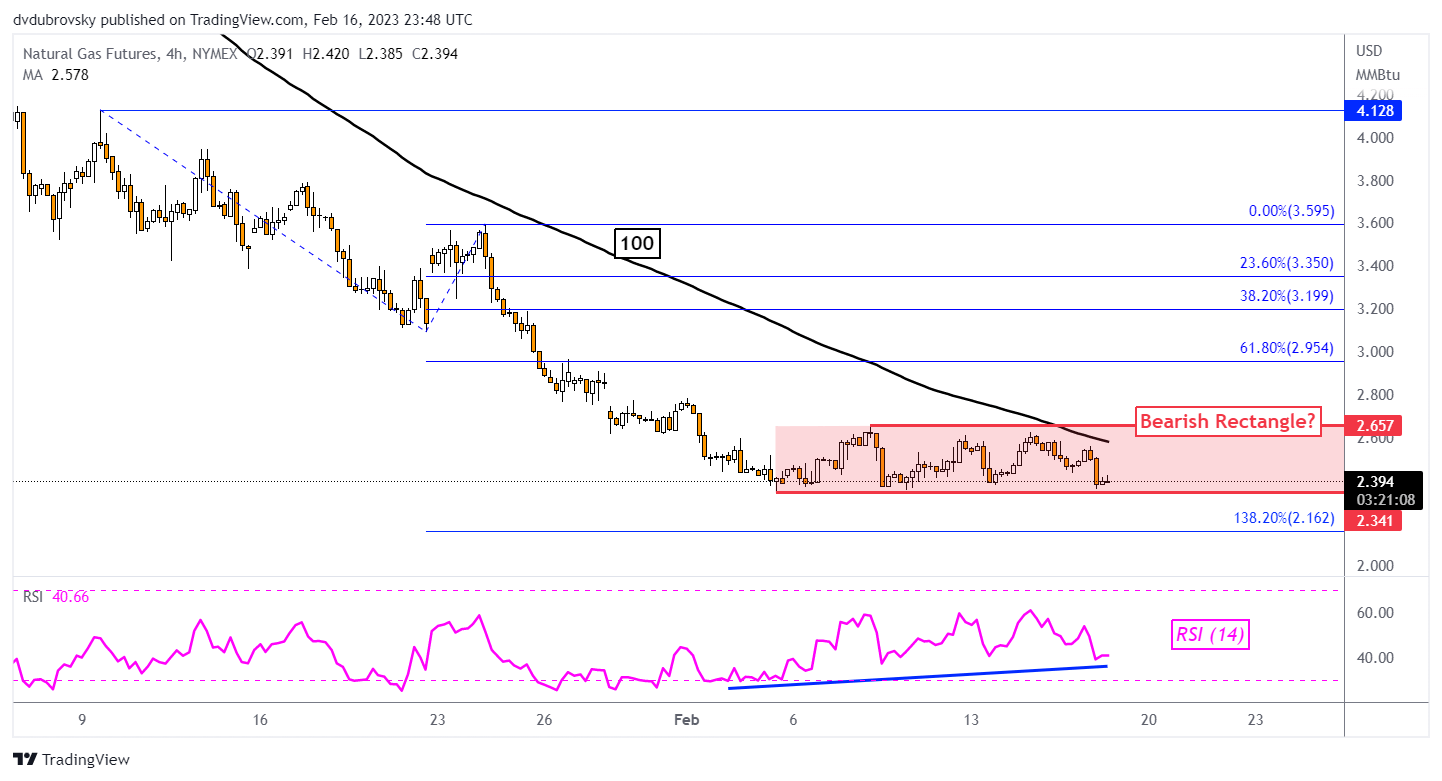
Chart Created Using TradingView
--- Written by Daniel Dubrovsky, Senior Strategist for DailyFX.com
To contact Daniel, follow him on Twitter:@ddubrovskyFX


