


Natural Gas, RSI, Bearish Rectangle – Technical Update:
- Natural gas prices remain in a consolidation setting
- Positive RSI divergence shows momentum is fading
- However, Bearish Rectangle is eyed on 4-hour setting
Trade Smarter - Sign up for the DailyFX Newsletter
Receive timely and compelling market commentary from the DailyFX team
Daily Chart – Eyes on RSI
Natural gas prices continue to consolidate on the daily setting, marking a diversion from the aggressive downtrend seen from December through January. Broadly speaking, the technical trajectory seems biased lower following the formation of a bearish Head and Shoulders chart pattern on the weekly setting. This could be setting the commodity up for a revisit of 2020 lows.
Following the recent consolidation, we have seen positive RSI divergence emerge. This is a sign of fading downside momentum. While this is not a guarantee that a reversal is imminent, it will be important to continue monitoring price action in the days ahead. A breakout above the 20-day Simple Moving Average (SMA) could open the door to a broader reversal. Otherwise, extending losses exposes the 114.6% Fibonacci extension level at 1.555.
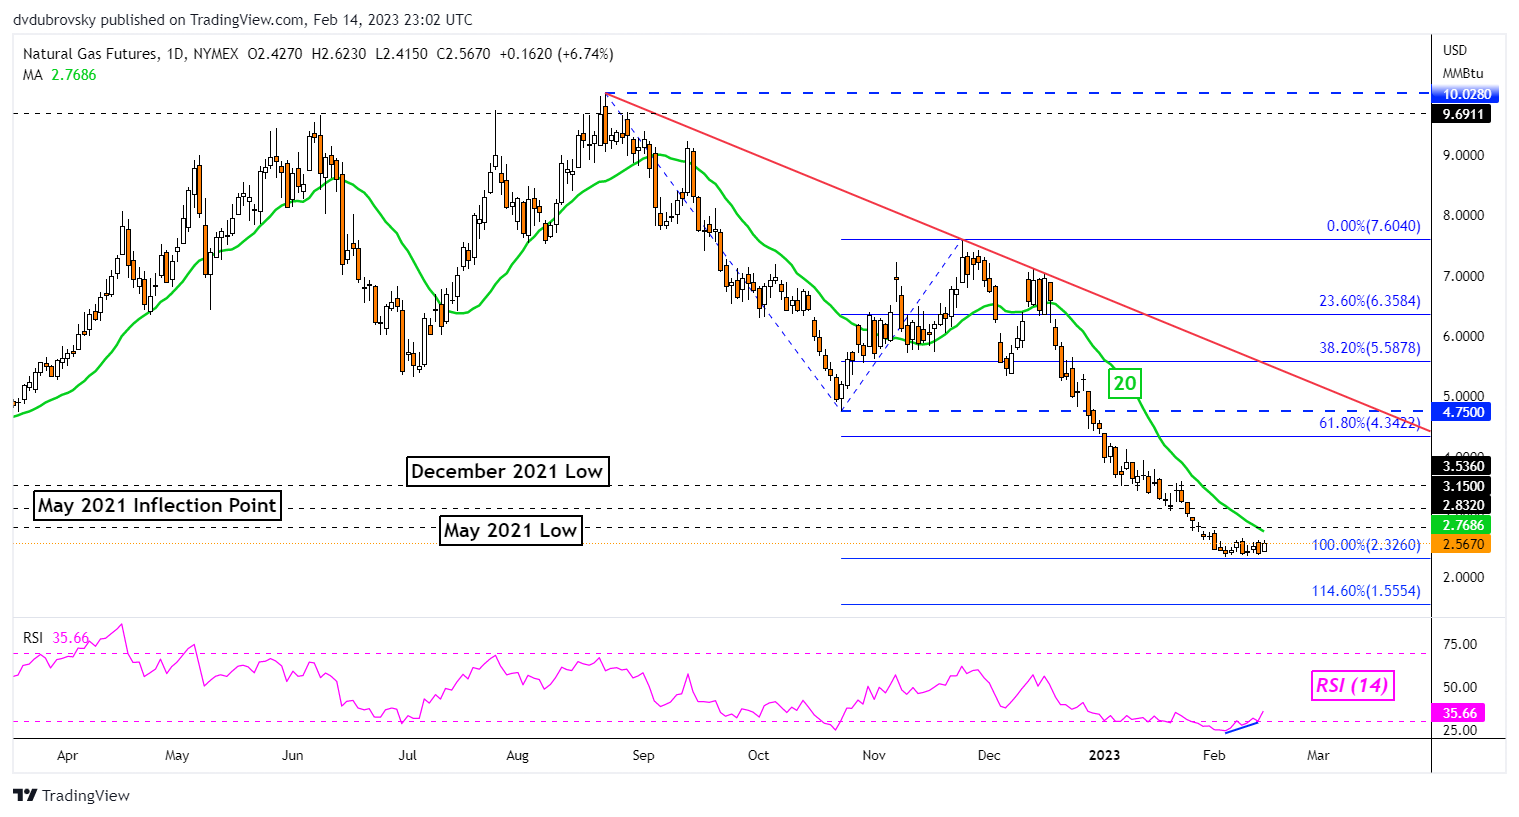
Chart Created Using TradingView
4-Hour Chart – Bearish Rectangle?
Zooming in on the 4-hour chart reveals something interesting is brewing. A Bearish Rectangle seems to be forming. Prices have been consolidating between an established floor – which is around 2.341 – as well as a ceiling – around 2.657. In this case, the rectangle is bearish because of the downtrend that occurred before the pattern’s formation.
While prices remain within the rectangle, the near-term trajectory may remain neutral. But, a downside breakout would open the door to extending losses towards the 138.2% Fibonacci extension level at 2.162. Otherwise, turning higher and rising above the 100-period SMA would likely increasingly offer a bullish technical outlook. That would place the focus on the January 24th high of 3.595.

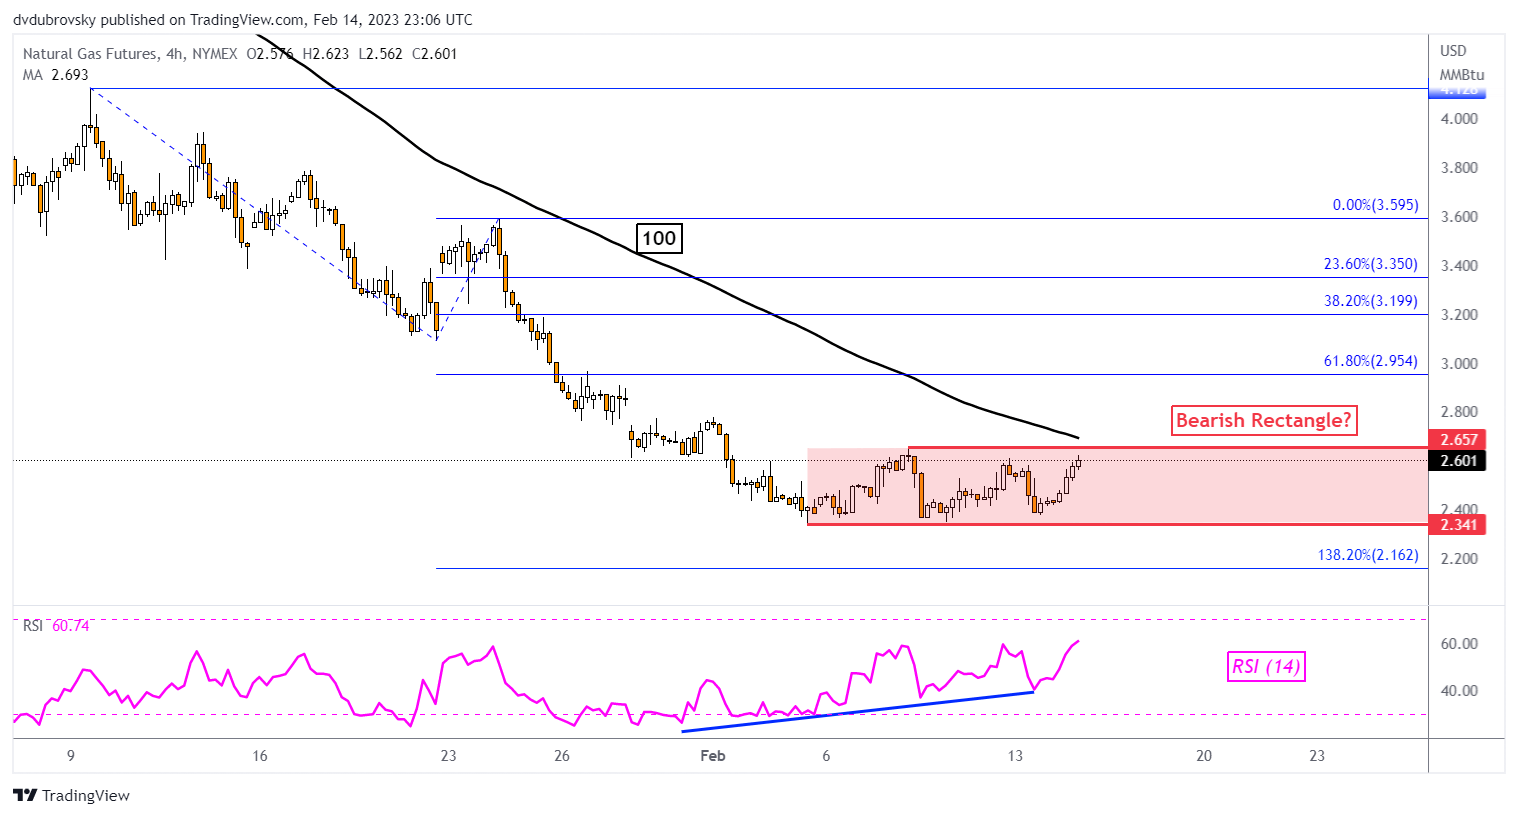
Chart Created Using TradingView
--- Written by Daniel Dubrovsky, Senior Strategist for DailyFX.com
To contact Daniel, follow him on Twitter:@ddubrovskyFX


