


Natural Gas, Support Breakout, Another Weekly Loss Ahead? – Technical Update:
- Natural gas prices extend drop, another weekly loss ahead?
- The daily chart shows that a key support level was taken out
- Bearish Rectangle breakout keeps building steam, as expected
Trade Smarter - Sign up for the DailyFX Newsletter
Receive timely and compelling market commentary from the DailyFX team
Weekly Chart – 2020 Lows Nearing
Natural gas prices are off to a rough start this week, which in recent memory, is not something out of the ordinary. Following a very brief pause in early February, the commodity is now aiming for a second consecutive weekly loss. If we ignore the negligible 4.32% rise in early February, natural gas is practically heading for a 10th weekly loss. You would have to go back to 2001 to find the same losing streak. This is bringing lows from 2020 closer into view.
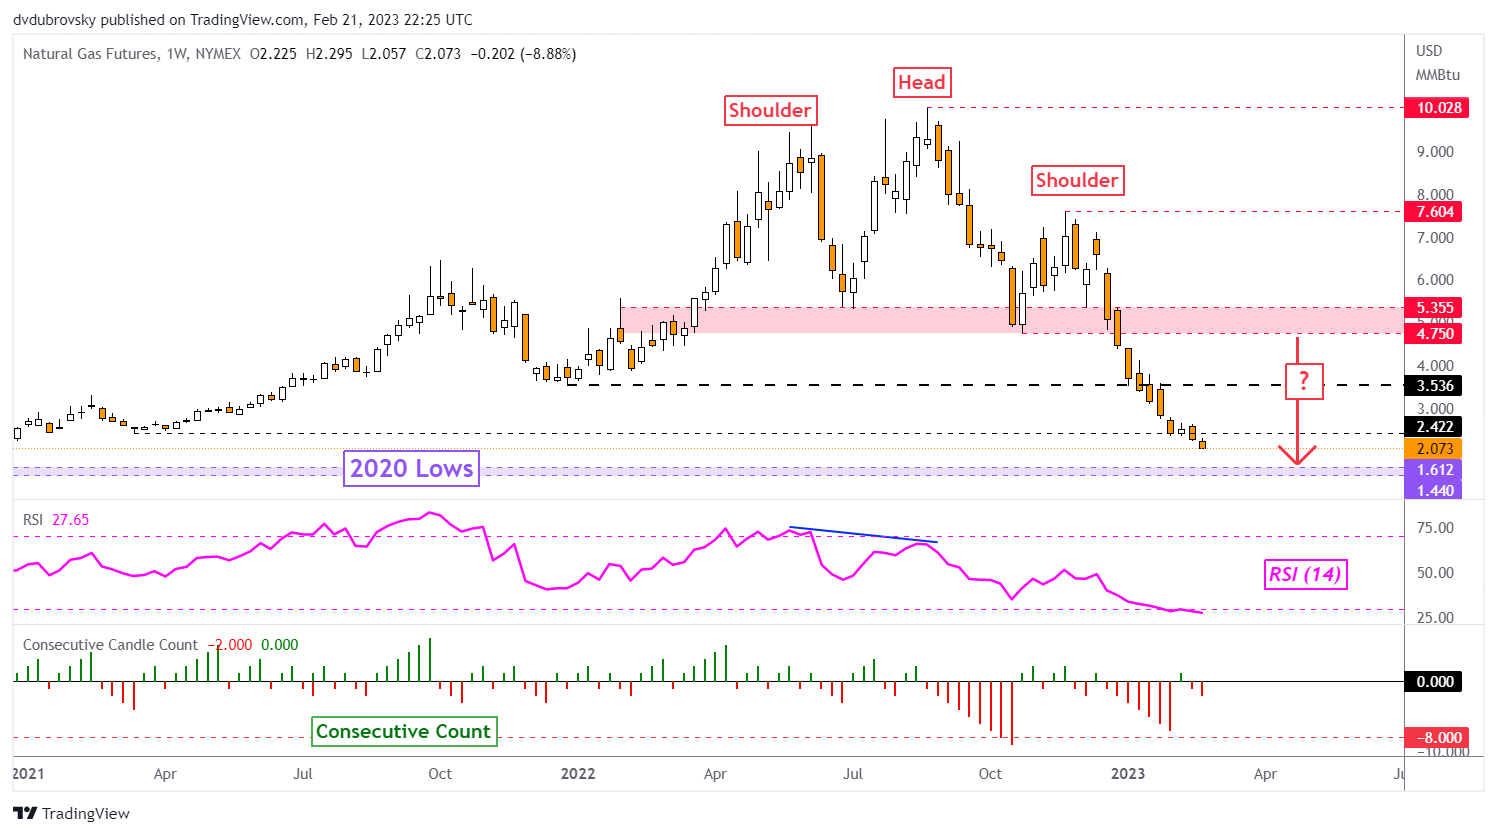
Chart Created Using TradingView
Daily Chart – Support Breakout Confirmed
On the daily setting, natural gas confirmed a breakout under the 100% Fibonacci extension level at 2.326. The 8.88% decline was the worst single-day performance since January 5th. That has exposed the 2020 low at 1.44. Practically speaking, lows from 2020 make up a zone of support between 1.44 and 1.612.
Meanwhile, positive RSI divergence remains present. This shows that downside momentum is fading. That can at times precede a turn higher. Even so, the commodity would have to clear the 20-day Simple Moving Average (SMA) which is maintaining the downside focus. Natural gas has not been above this moving average since December 16th, over 2 months ago.
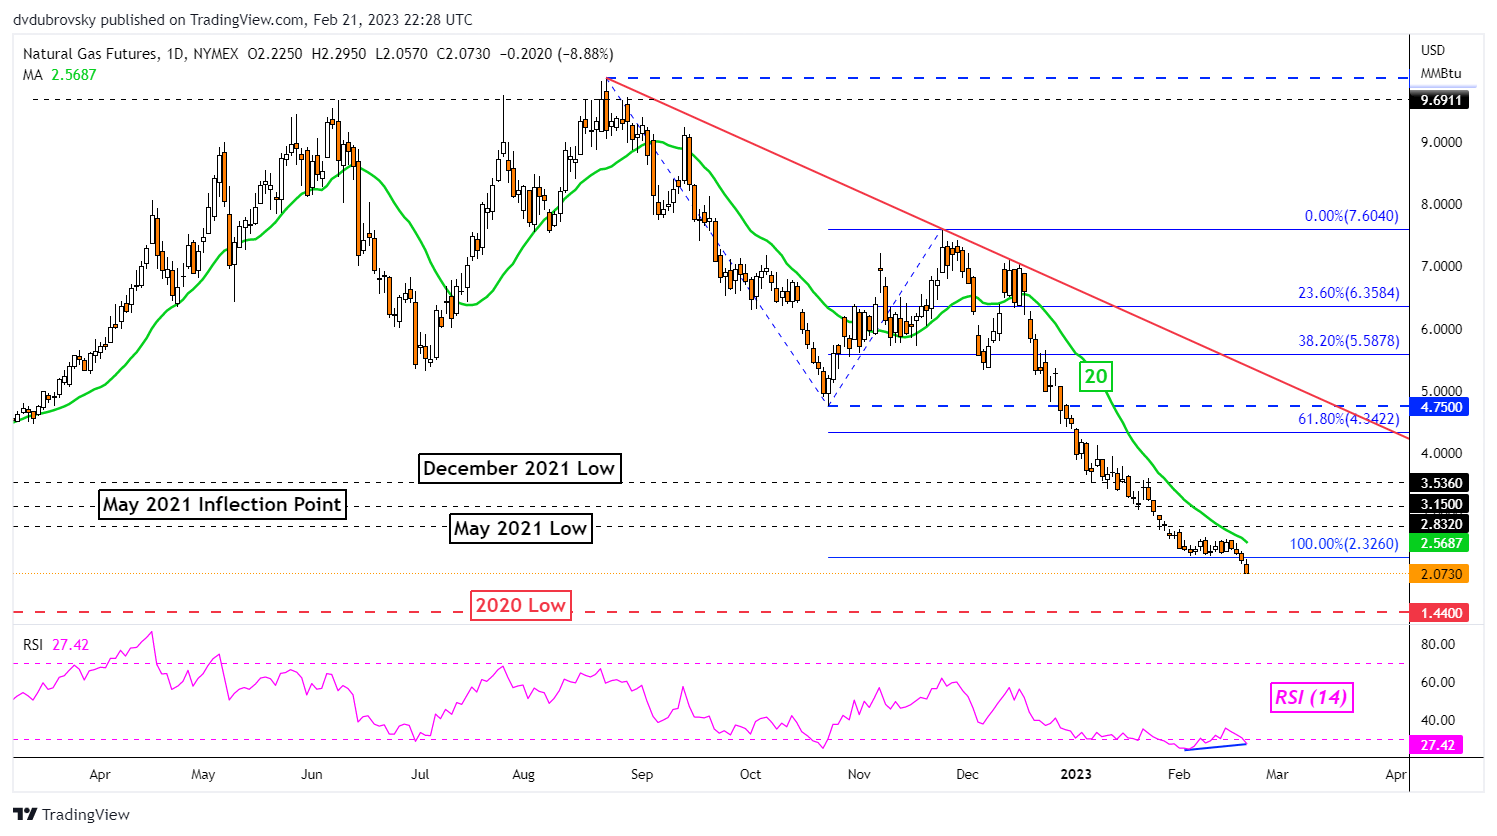
Chart Created Using TradingView
4-Hour Chart – Bearish Rectangle Breakout Extends
Taking a look at the 4-hour chart, natural gas prices have extended lower after breaking underneath a Bearish Rectangle chart formation – as expected. Now, prices are facing immediate support, which seems to be the 150% Fibonacci extension level at 2.040. Clearing this price exposes the 16.8% level at 1.917 before the 178.6% point at 1.743 kicks in. In the event of a turn higher, keep a close eye on the floor of the rectangle. The latter could kick in as new resistance.
{{FUNDAMENTALS BREAKOUT TRADING}}
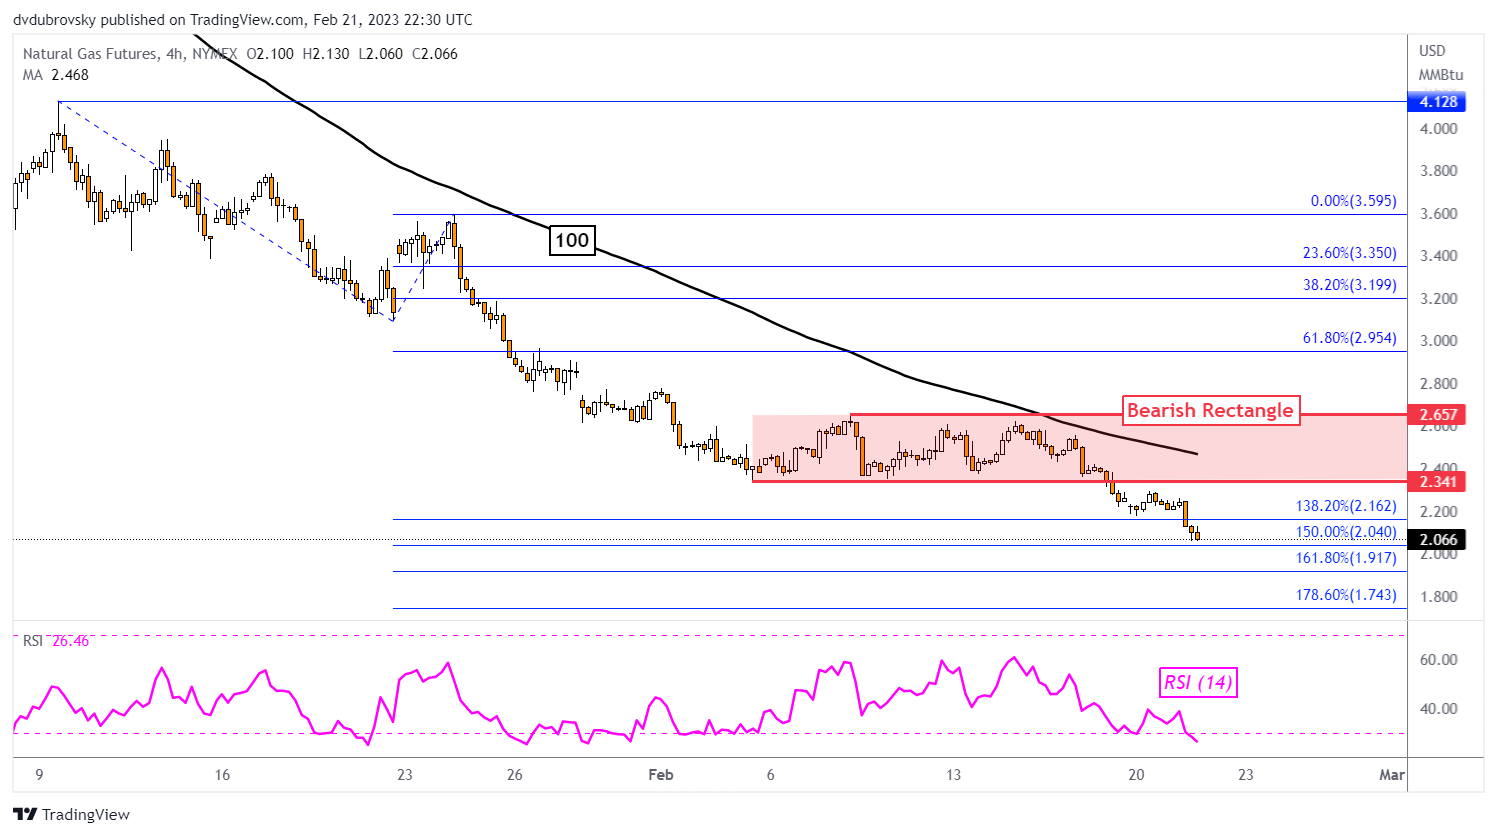
Chart Created Using TradingView
--- Written by Daniel Dubrovsky, Senior Strategist for DailyFX.com
To contact Daniel, follow him on Twitter:@ddubrovskyFX


