


Natural Gas, Fading Momentum, Wedge Breakout Struggling – Technical Update:
- Natural gas prices continue stabilizing above February lows
- Downside momentum is fading, hinting at a turn higher ahead
- But a Falling Wedge breakout has struggled to materialize
Trade Smarter - Sign up for the DailyFX Newsletter
Receive timely and compelling market commentary from the DailyFX team
Daily Chart – Fading Moment at Support
Natural gas prices continue to mark time with the heating commodity stabilizing around key support. That would be the February low at 1.967. Meanwhile, positive RSI divergence continues to brew. This is a sign of fading downside momentum, which can at times precede a turn higher. Meanwhile, the 50-day Simple Moving Average (SMA) is closing in from above.
This line could reinstate the downside focus, holding as key resistance. Extending lower would open the door to downtrend resumption, exposing the 23.6% Fibonacci extension level at 1.696 towards the 2020 bottom at 1.44. Otherwise, pushing above the moving average would open the door to a near-term upside bias, placing the focus on the March high at 3.027.
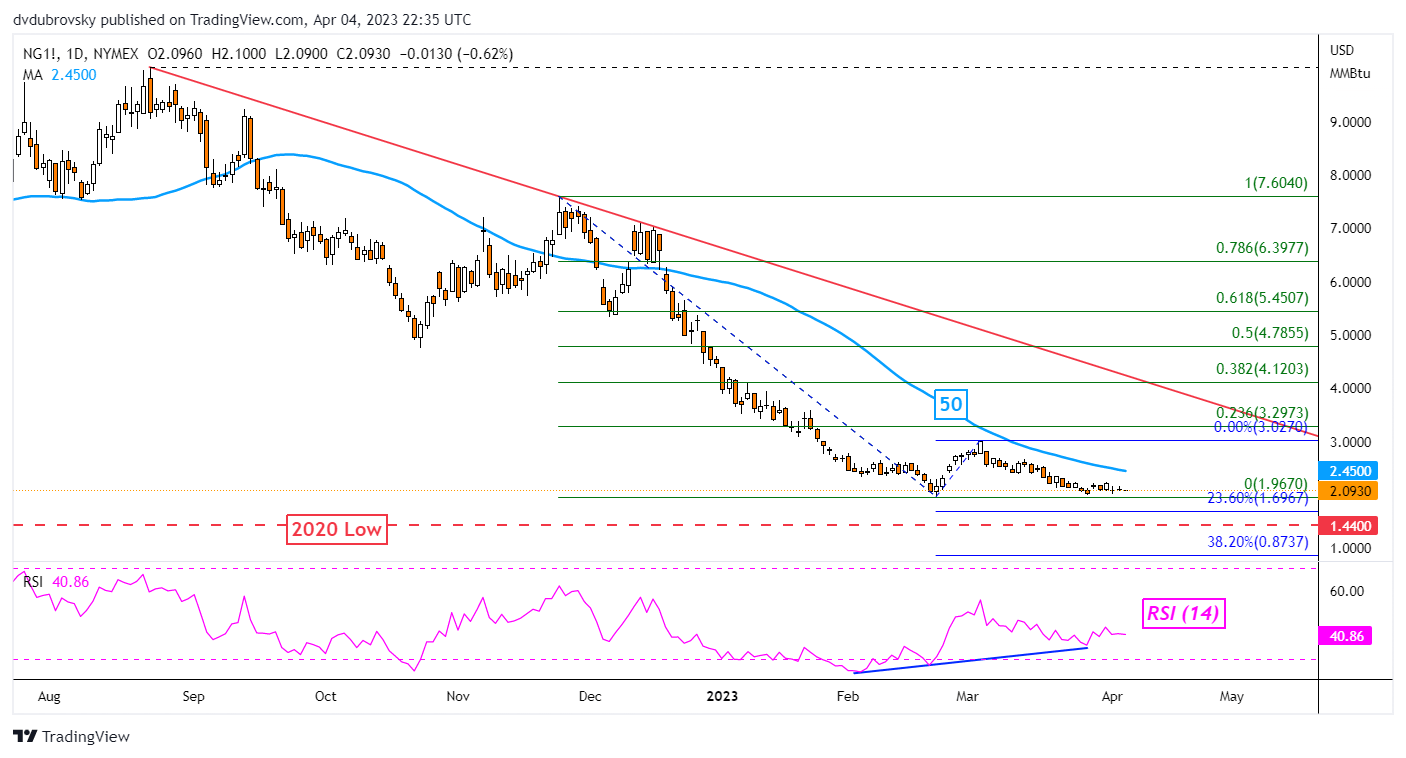
Chart Created Using TradingView
4-Hour Chart – Wedge Breakout Struggling
Last week, natural gas broke above a bullish Falling Wedge chart formation when looking at the 4-hour setting. That opened the door to a bullish reversal at the same time positive RSI divergence was brewing. Yet, so far such an outcome has not materialized. The 78.6% Fibonacci retracement level at 2.195 has been holding as key resistance.
That is undermining the bullish implications of the wedge. Clearing under 1.968 would overturn the wedge, opening the door to extend lower. On the flip side, pushing past resistance places the focus on the 100-period SMA. This could reinstate the downside bias. Otherwise, key levels to watch in the near term include the 61.8% and 38.2% points at 2.373 and 2.622, respectively.

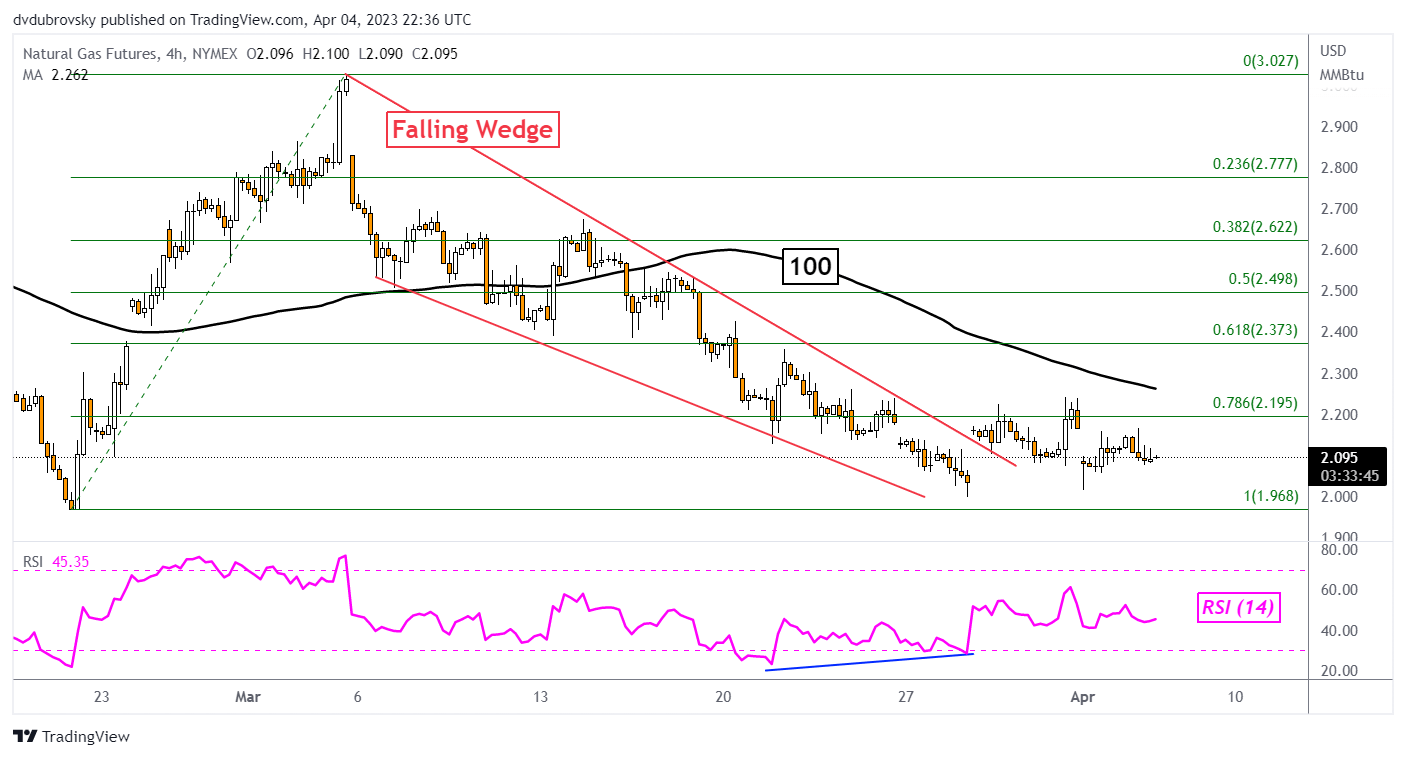
Chart Created Using TradingView
--- Written by Daniel Dubrovsky, Senior Strategist for DailyFX.com
To contact Daniel, follow him on Twitter:@ddubrovskyFX


