


Natural Gas, Losing Streak Ends, Dojis Brewing – Technical Update:
- Natural gas prices ended a 7-week losing streak, rising 4.32%
- The daily chart reveals that downside momentum is slowing
- This is as multiple Doji candlesticks show more indecision
Trade Smarter - Sign up for the DailyFX Newsletter
Receive timely and compelling market commentary from the DailyFX team
Weekly Chart – 8th Week of Losses Narrowly Avoided
Natural gas prices managed to end last week on a positive note, albeit it was very lackluster. The commodity gained just 4.32% over the past 5 trading sessions, which in the context of consistent losses since the second half of last year, is barely noticeable. Still, it did mean that an 8th consecutive week of losses was avoided, finally bringing the longest losing streak since October to an end.
Prices were unable to clear the March 2021 low at 2.422 for 2 weeks in a row. Still, the weekly candle shows little signs of a reversal brewing as support was reinforced. Moreover, the anticipated trajectory of the bearish Head & Shoulders from last year remains in focus. If prices reach the target, it could mean testing lows from 2020. The latter is a range between 1.44 and 1.61.
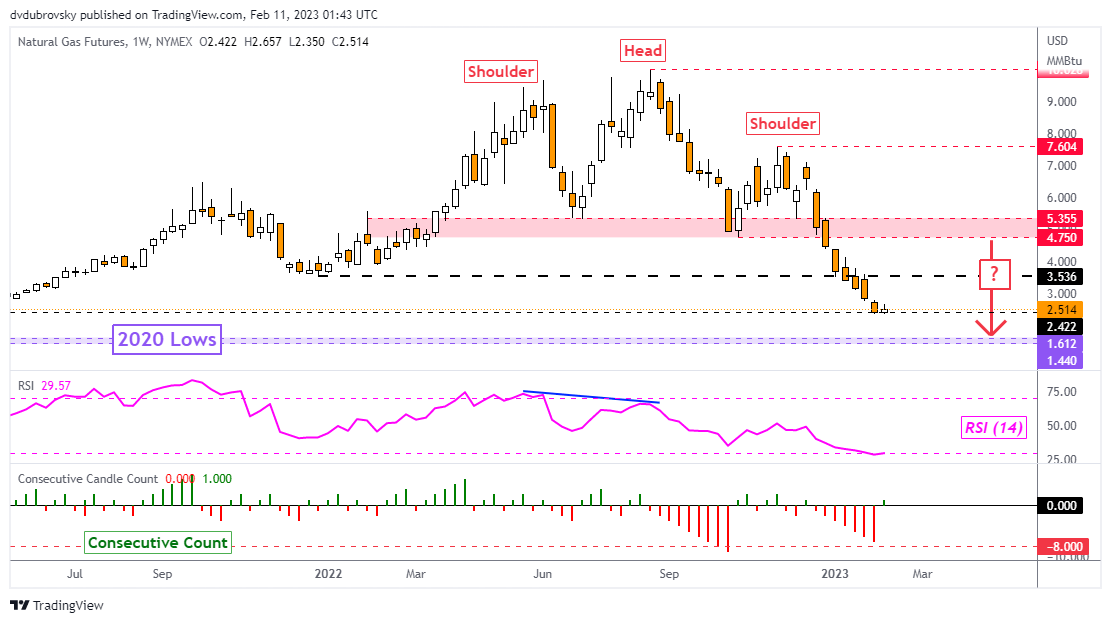
Chart Created Using TradingView
Daily Chart – More Dojis Brewing Around Support
Taking a look at the daily chart, we can see that multiple Doji candlestick patterns have been forming since prices approached the 100% Fibonacci extension level at 2.326. This is an increasing sign of indecision, which can at times spell a reversal within the context of trending markets. Positive RSI divergence is also present, showing that downside momentum is fading.
A turn higher would likely place the focus on the 20-day Simple Moving Average (SMA). The latter could reinstate the dominant downside focus. If not, a confirmatory upside close above the SMA could open the door to a broader reversal. That would place the focus on lows from December 2021 around 3.536. The latter could hold as new resistance.
Otherwise, extending lower would place the focus back on the downside. That exposes the 114.6% extension at 1.555 towards lows from 2020.

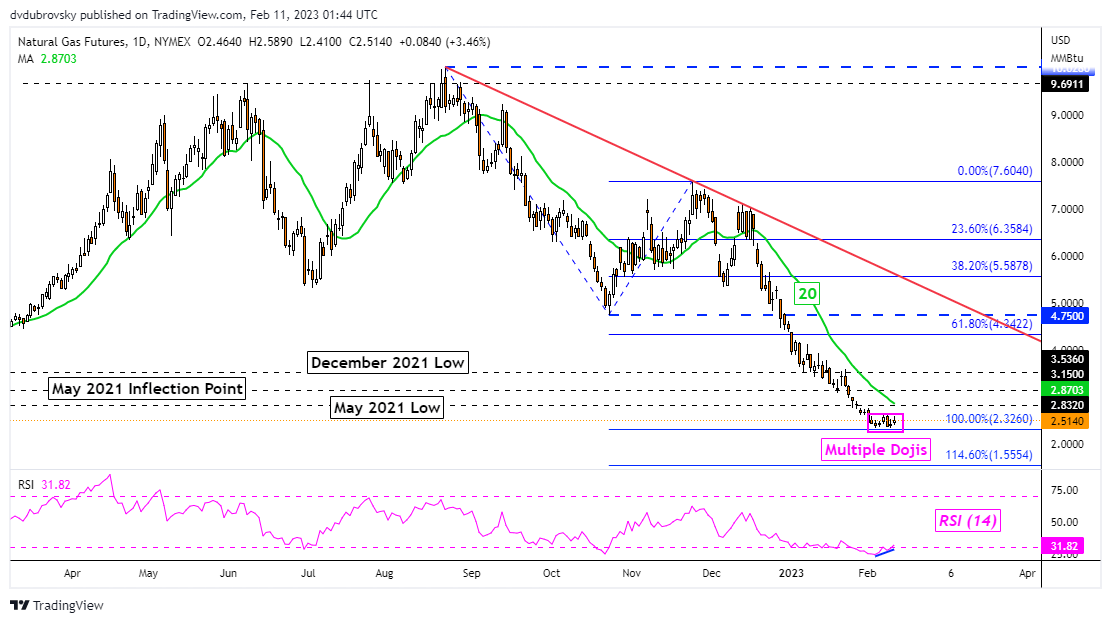
Chart Created Using TradingView
--- Written by Daniel Dubrovsky, Senior Strategist for DailyFX.com
To contact Daniel, follow him on Twitter:@ddubrovskyFX


