


KOSPI, KOSPI COMPOSITE INDEX, ASX, ASX 200 INDEX - TECHNICAL OUTLOOK:
- KOSPI index appears to be struggling at key resistance.
- ASX 200 index has failed to capitalize on the gains earlier in the month.
- Are the indices about to turn down and what are the key levels to watch?

KOSPI SHORT-TERM TECHNICAL OUTLOOK - BEARISH
The failure of South Korea’s Kospi Composite Index to rise above key resistance raises the risk of a retest of the recent low, or perhaps possibly even lower.
In recent days, the Kospi has failed to rise above crucial converged resistance: the July low of 2277, coinciding with the internal downtrend line within a declining channel from 2021 (see chart). Given the feeble and shallow rebound this month, the risks of a retest of the September low of 2135 have risen. Any break below could open the way toward the lower edge of the channel (now at about 2050). Subsequent support is at the mid-June 2020 low of 2030 followed by stronger support at 1840 (the 78.6% retracement of the 2020-2021 rally).
KOSPI COMPOSITE INDEX Daily Chart
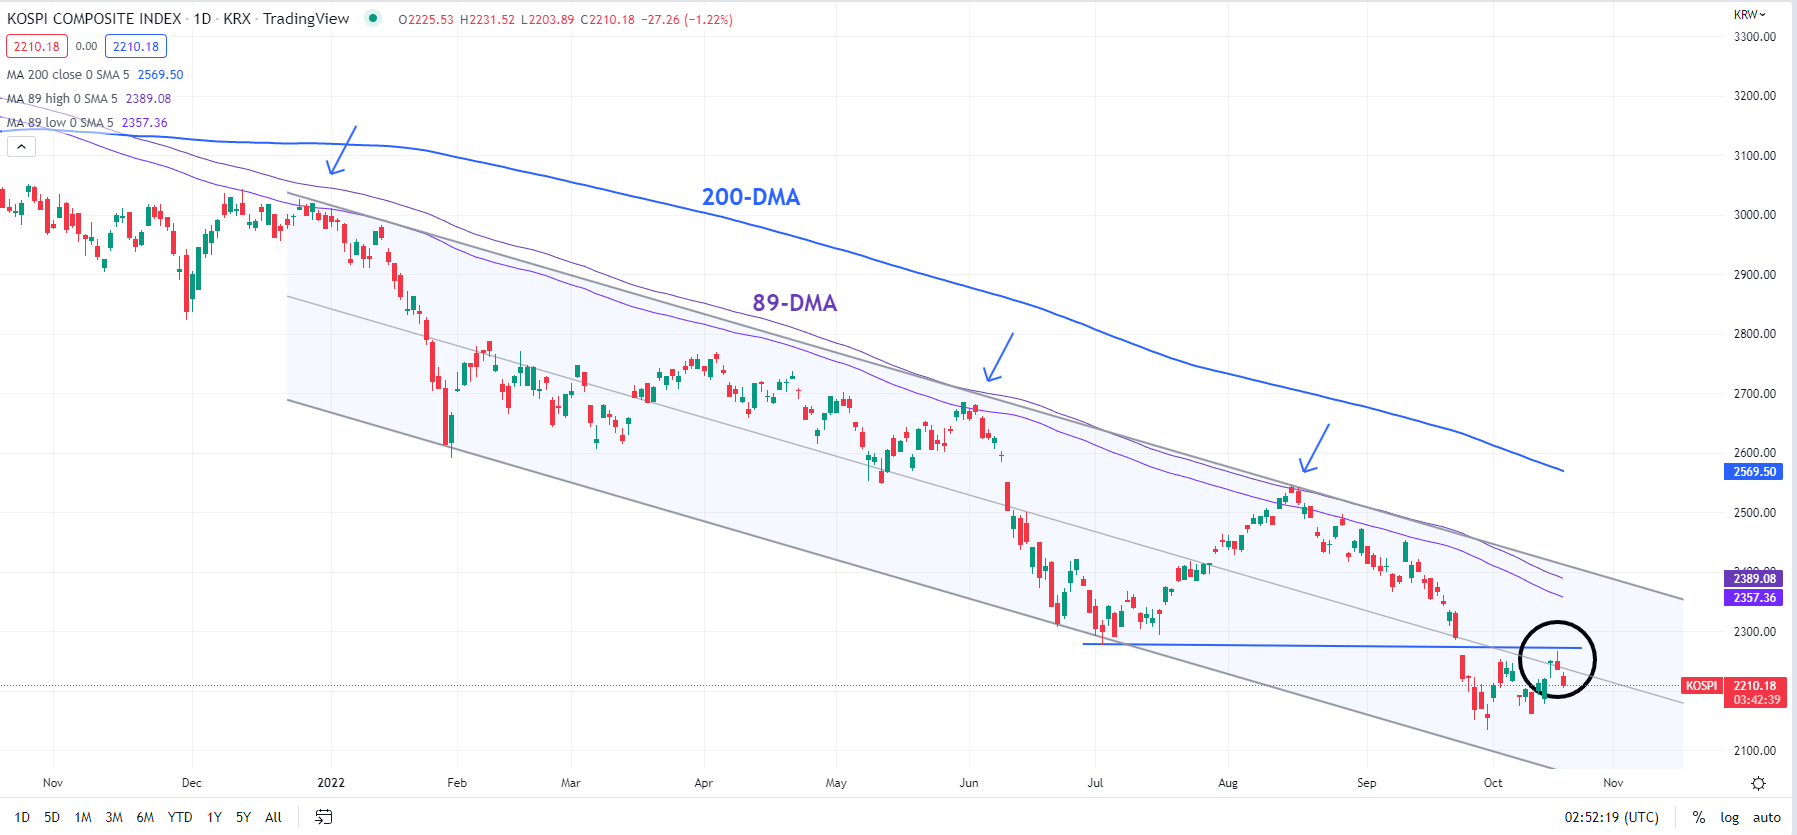
Chart Created Using TradingView
Kospi’s fall this year below the 200-week moving average indicates that the medium-term trend has turned down. For a change/reversal of the downtrend, at minimum, the index needs to break some resistance – the most immediate one being 2277 followed by stronger resistance on the upper edge of a declining channel from 2021 (now at about 2410). As the chart shows, the index has failed to do so in recent months, reasserting the weak outlook.

ASX 200 SHORT-TERM TECHNICAL OUTLOOK – SLIGHTLY BEARISH
In the past couple of weeks, Australia’s ASX 200 Index has struggled to capitalize on the early-month gains, capped by tough resistance around the August low of 6746, not too far from the top edge of a declining channel from April.
ASX 200 INDEX Weekly Chart
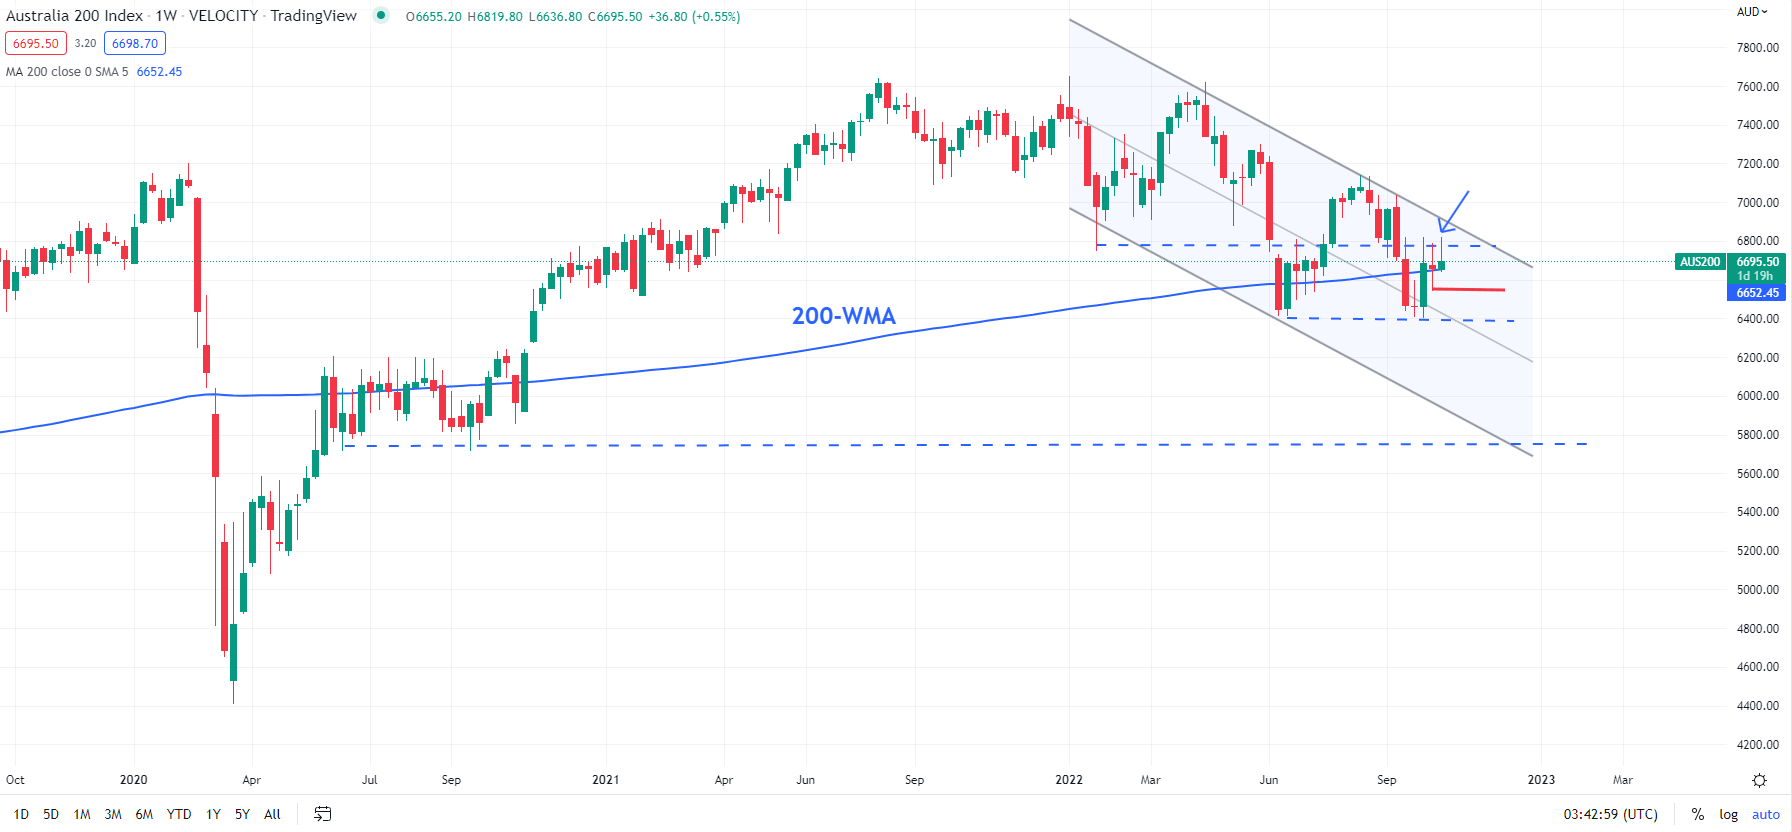
Chart Created Using TradingView
The stall in price action recently reflects a tug of war between the bulls and bears – strong bids seem to emerge when the index falls below vital support on the 200-week moving average. But those bids have failed so far failed to alter the broader soft outlook – either bids haven’t been sustained or have been met by strong selling pressure. However, the tussle may not last long.
If the index falls below last week’s low of 6542, it will raise the risk of a retest of the June and October lows of around 6400, possibly the lower edge of the channel (now at 5950), slightly above the June 2020 and September 2020 lows of around 5720. On the other hand, for the bulls to gain meaningful control, the index needs to break above converged resistance at 6746-6920 (including the upper edge of the channel from April).

--- Written by Manish Jaradi, Strategist for DailyFX.com


