


US Dollar, Japanese Yen, USD/JPY - Technical Outlook:
- USD/JPY downward correction may not be over just yet.
- There is a chance of a drop toward the 200-day moving average
- What are the signposts to watch?

USD/JPY SHORT-TERM TECHNICAL FORECAST – SLIGHTLY BEARISH
The failure of USD/JPY to extend gains last week could be a warning sign of some more downside in the near term.
USD/JPY turned lower from the November 21 high 142.25, coming off key resistance on the 89-day moving average. The last time it was decidedly below this barrier was in early 2021. The three-month moving average has now turned into resistance, having acted as support earlier.
USD/JPY 240-minutes Chart
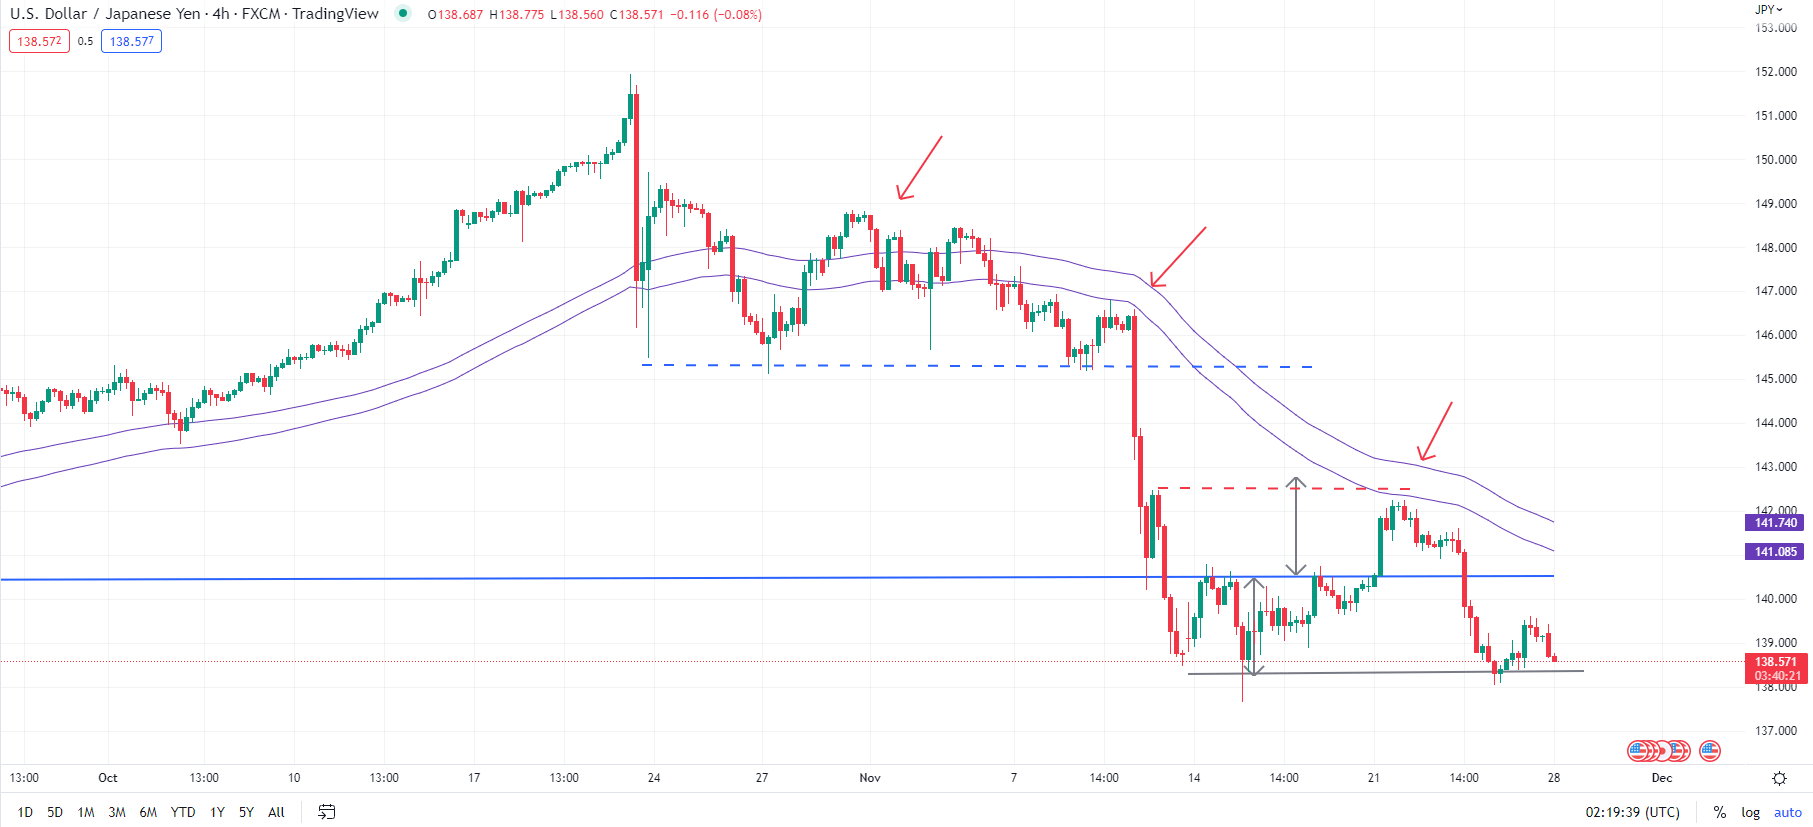
Chart Created Using TradingView
Importantly, the pair has reversed gains from below 143.00-143.15 (the 50% retracement of the decline on the week of November 7-11) and has failed to cross a similar retracement of the big bearish candlestick that appeared on the daily chart on November 10.
When a large-body candle such as the one created on the weekly chart of November 7-11 and the daily chart on November 10 appears, the 50% retracement of that candle tends to serve as solid resistance from a trend perspective. Big moves are a reflection of greater conviction amongst market participants and an indication of the trend.

USD/JPY Daily Chart
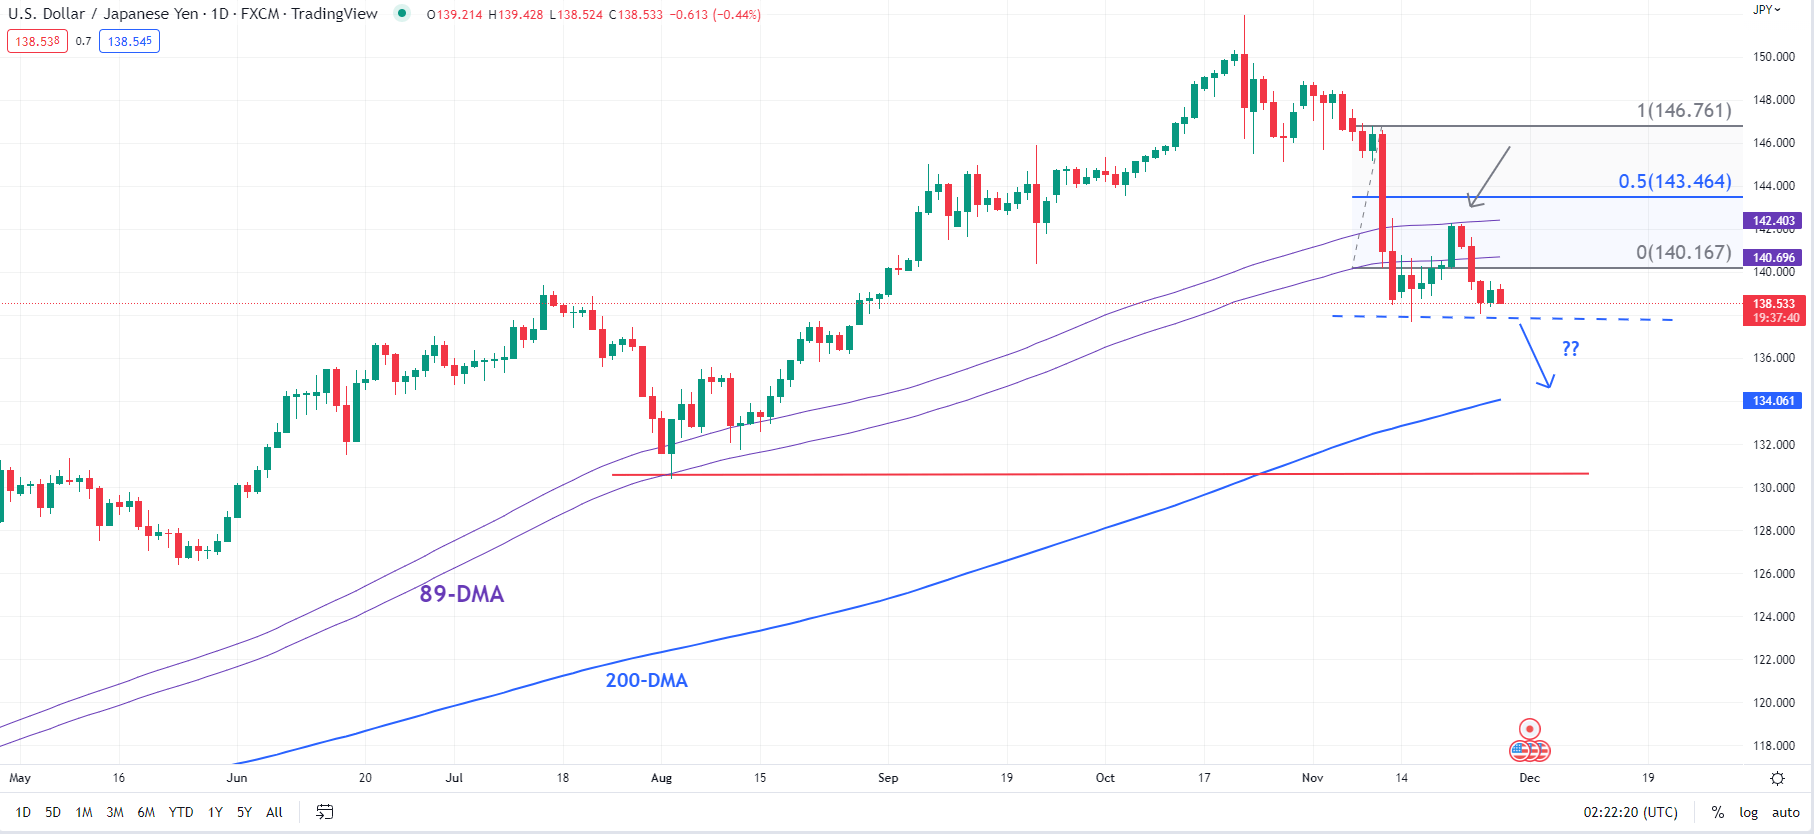
Chart Created Using TradingView
In a case where a large bearish candle appears, the chances of a renewed decline reduce meaningfully if the subsequent rebound clears the halfway mark, as opposed to a condition where that 50% hurdle is not pierced. In the latter case, the chance of a retest of the previous low increases.
USD/JPY is now back near this month’s low of 137.70, flashing a red signal for a drop toward the 200-day moving average (now at about 134.00). For the odds of a decline toward the 200-day moving average to reduce, USD/JPY needs to clear the immediate ceiling is at 142.25. Even then, resistance in the 143.00-143.15 area would remain the line in the sand.

--- Written by Manish Jaradi, Strategist for DailyFX.com


