


Gold, XAU/USD, Silver, XAG/USD - Technical Outlook:
- Gold appears to have found support in the short term.
- Silver could be headed toward the top end of its three-month range.
- The upside in precious metals could be capped.

GOLD SHORT-TERM TECHNICAL OUTLOOK – NEUTRAL
Gold appears to have found a short-term floor and could settle in a range with a modest upward bias in the coming days.
The yellow metal continues to flirt with key converged support: a horizontal trendline from 2021 at about 1675-1680, roughly coinciding with the 200-week moving average. While losses stalling recently could be interpreted as a sign of rejection at lower levels (that is, a lack of conviction below the September low of 1614), it could well be a matter of time before XAU/USD resumes its next leg lower. In this regard, tonight’s US Federal Reserve rate decision and the accompanying tone would be closely watched.
The Fed is widely expected to hike by another 75 basis points after the conclusion of its two-day meeting on Wednesday. If the US central bank doesn’t signal a slowdown in its aggressive monetary tightening cycle, gold could witness a minor relief rally. Markets have been expecting a pivot in the monetary policy after minutes of the last Fed meeting in September stated that participants observed it would become appropriate at some point to slow the pace of rate increases.
XAU/USD Daily Chart
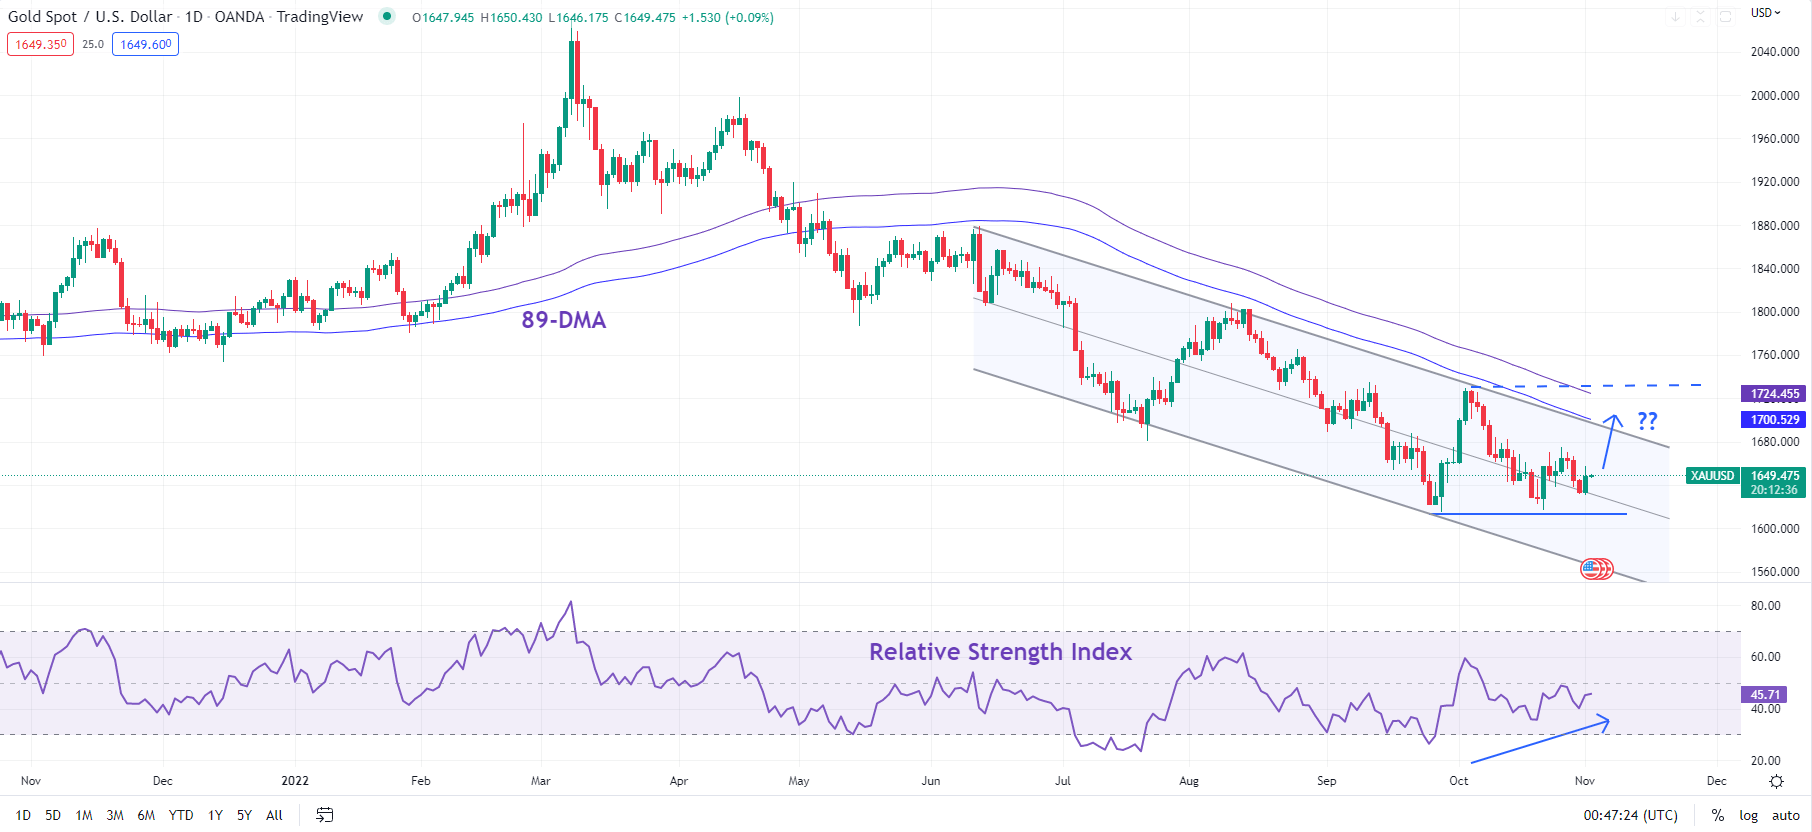
Chart Created Using TradingView
Broadly, XAU/USD continues to remain in a range,as highlighted two weeks ago. The upper end of the recent range is at 1725. The lower edge of the range is around 1614. Most recently, positive momentum divergence on the daily charts (falling/sideway price action associated with rising momentum) raises the odds that XAU/USD could rise toward the upper end of the range.
{{GUIDE|HOW_TO_TRADE_GOLD}}
SILVER SHORT-TERM TECHNICAL OUTLOOK - NEUTRAL
The range in Silver is perhaps more defined compared to gold. Since July, XAG/USD has been hovering in a 17.50-21.25 range, holding above horizontal trendline support from 2019-2020 highs, and the 200-week moving average to cap its upside.
XAG/USD Weekly Chart
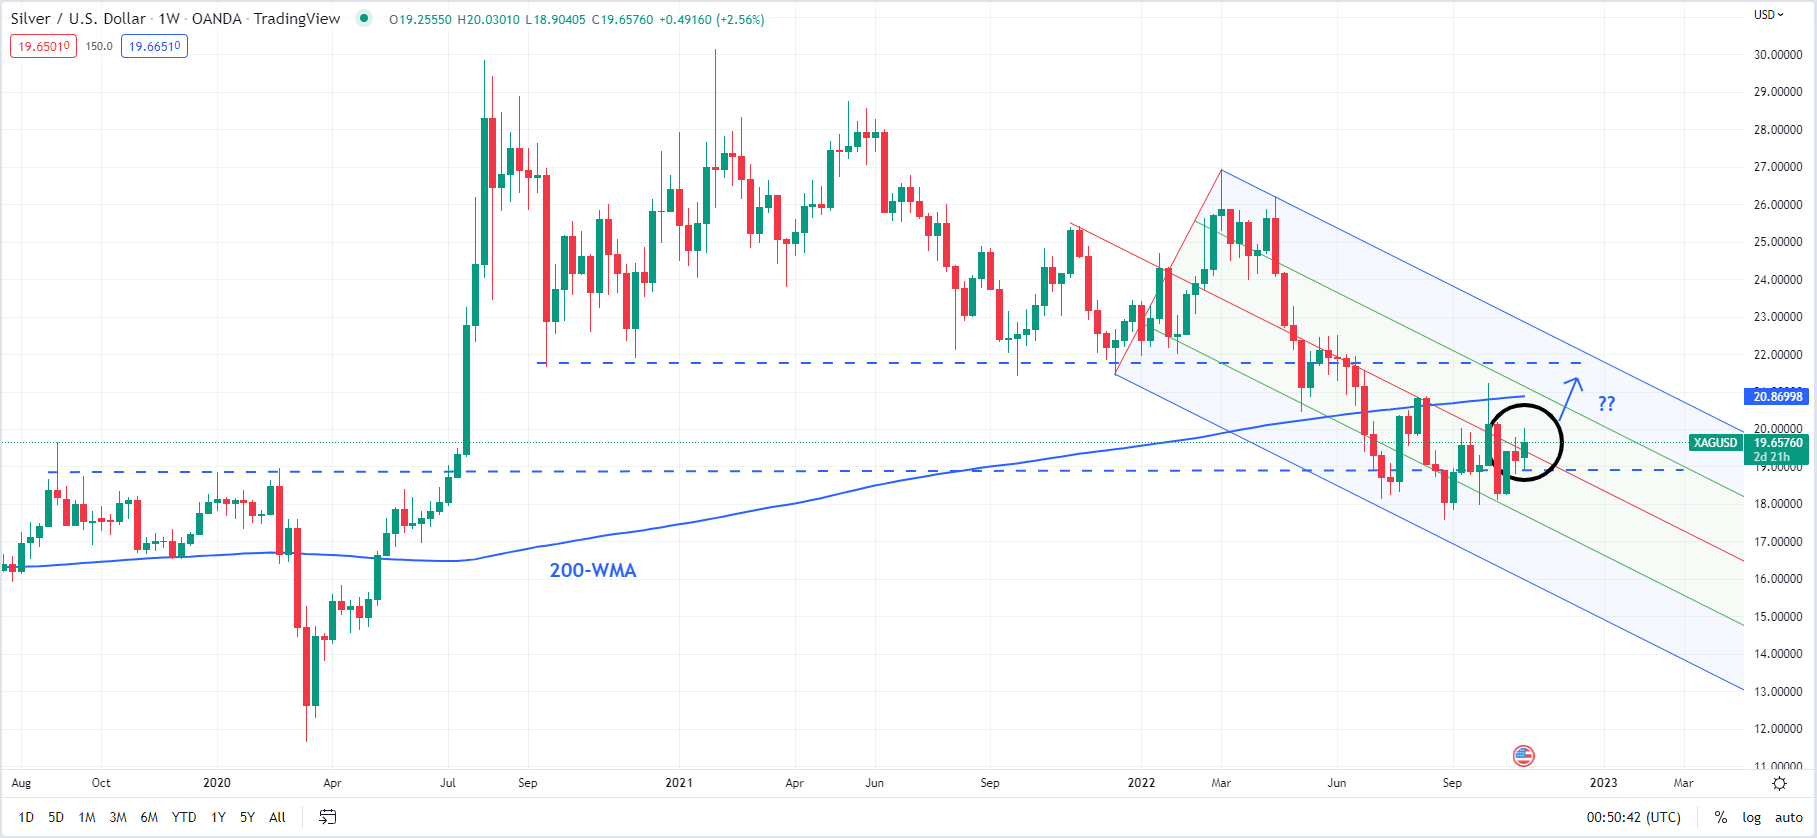
Chart Created Using TradingView
While the overall bias for Silver continues to be neutral, a minor rally toward the upper edge of the range is possible. After a failed attempt on Tuesday to break above immediate resistance at last week’s high of 19.80, Silver is yet again retesting the resistance. A decisive break above the resistance could push XAG/USD toward 21.25, close to the 200-day moving average (now at about 21.50).
Beyond the short term, however, the balance of risks is tilted towards the downside for XAG/USD. There is tough resistance at 21.25-21.50 (including the 200-day moving average), and Silver would need to break above this resistance for the medium-term downward pressure to fade.

--- Written by Manish Jaradi, Strategist for DailyFX.com


