


DAX, FTSE, German DAX Index, UK FTSE Index - Technical Outlook:
- DAX has run into stiff resistance.
- FTSE’s rebound appears to be corrective.
- What is the outlook and what are the key levels to watch?

DAX TECHNICAL FORECAST - NEUTRAL
The strong rebound in the German DAX index over the past two weeks may have been an encouraging sign for bulls. However, the index may not be ripe for a bullish break just yet. That is, the recent sideways price action could continue in the interim.
DAX INDEX Daily Chart

Chart Created Using TradingView
The index, up nearly 8% since late March, is now testing quite a strong ceiling at the March high of 15706. This follows a rebound last month from a fairly strong converged cushion – the 89-day moving average, the lower edge of the Ichimoku cloud on the daily chart, and the end-2022 highs. However, the colour-coded candlestick charts suggest that the index remains in a consolidation phase that started in late February.
DAX INDEX Daily Chart
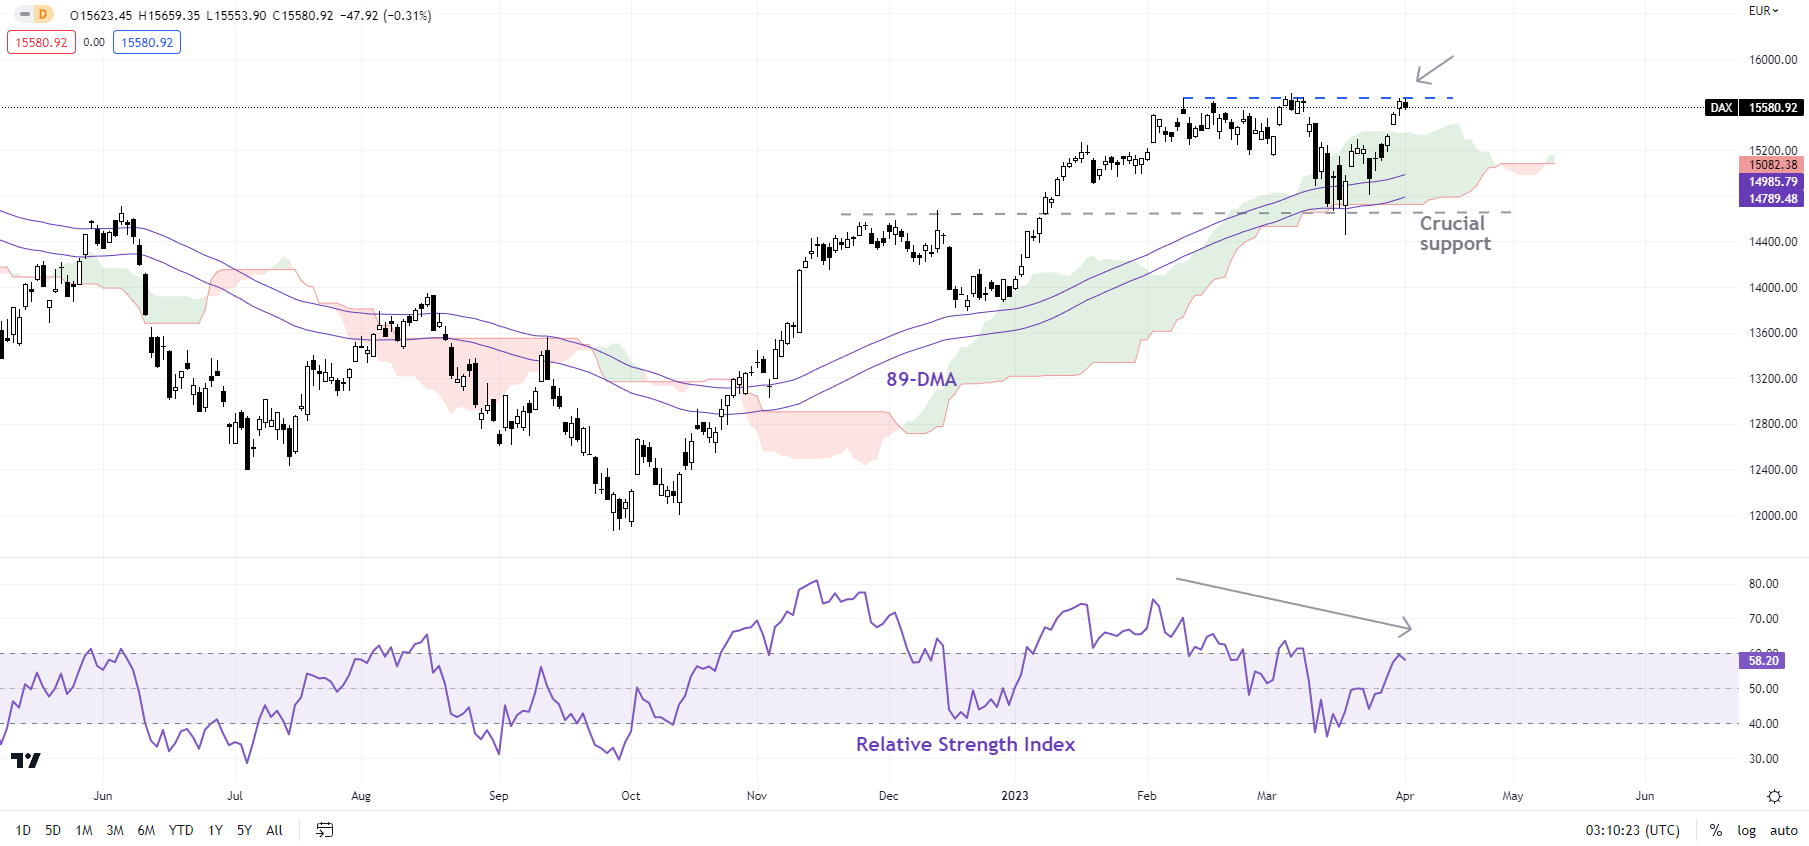
Chart Created Using TradingView
Moreover, a negative divergence (rising index associated with declining momentum) on the weekly charts indicates that the two-week-long rally is losing steam. This divergence raises the bar for the index to decisively break above the crucial ceiling. While this doesn’t mean that the broader uptrend is reversing, it implies ‘more of the same’ – that is, the recent consolidation/sideway range could continue.
FTSE INDEX Daily Chart
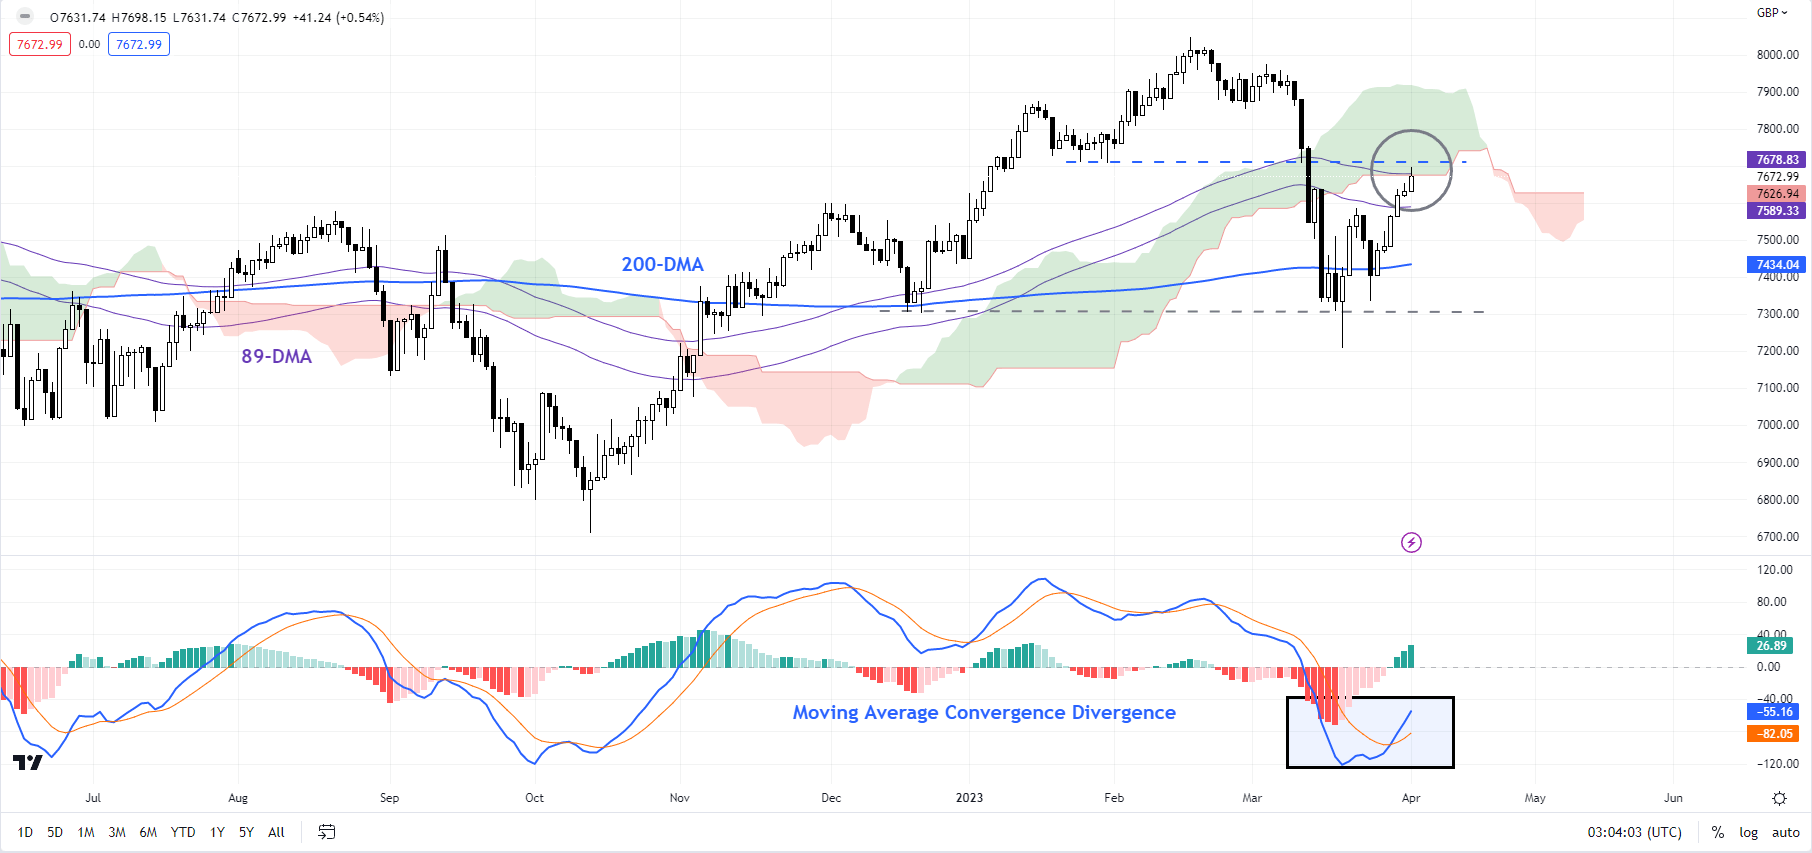
Chart Created Using TradingView
As the broader uptrend is in place, the break of the 15706 resistance appears to be a matter of time, but not imminently. On the other hand, only a break below immediate support at 14458 would indicate that the upward pressure had eased.
FTSE TECHNICAL FORECAST – NEUTRAL
The UK FTSE 100 index is running into a vital cap: the 89-day moving average, the lower edge of the Ichimoku cloud on the daily chart, near the January low of 7708. Importantly, while the upward momentum has seemingly picked up for now, the Moving Average Convergence Divergence indicator remains firmly in bearish territory.
FTSE INDEX Monthly Chart
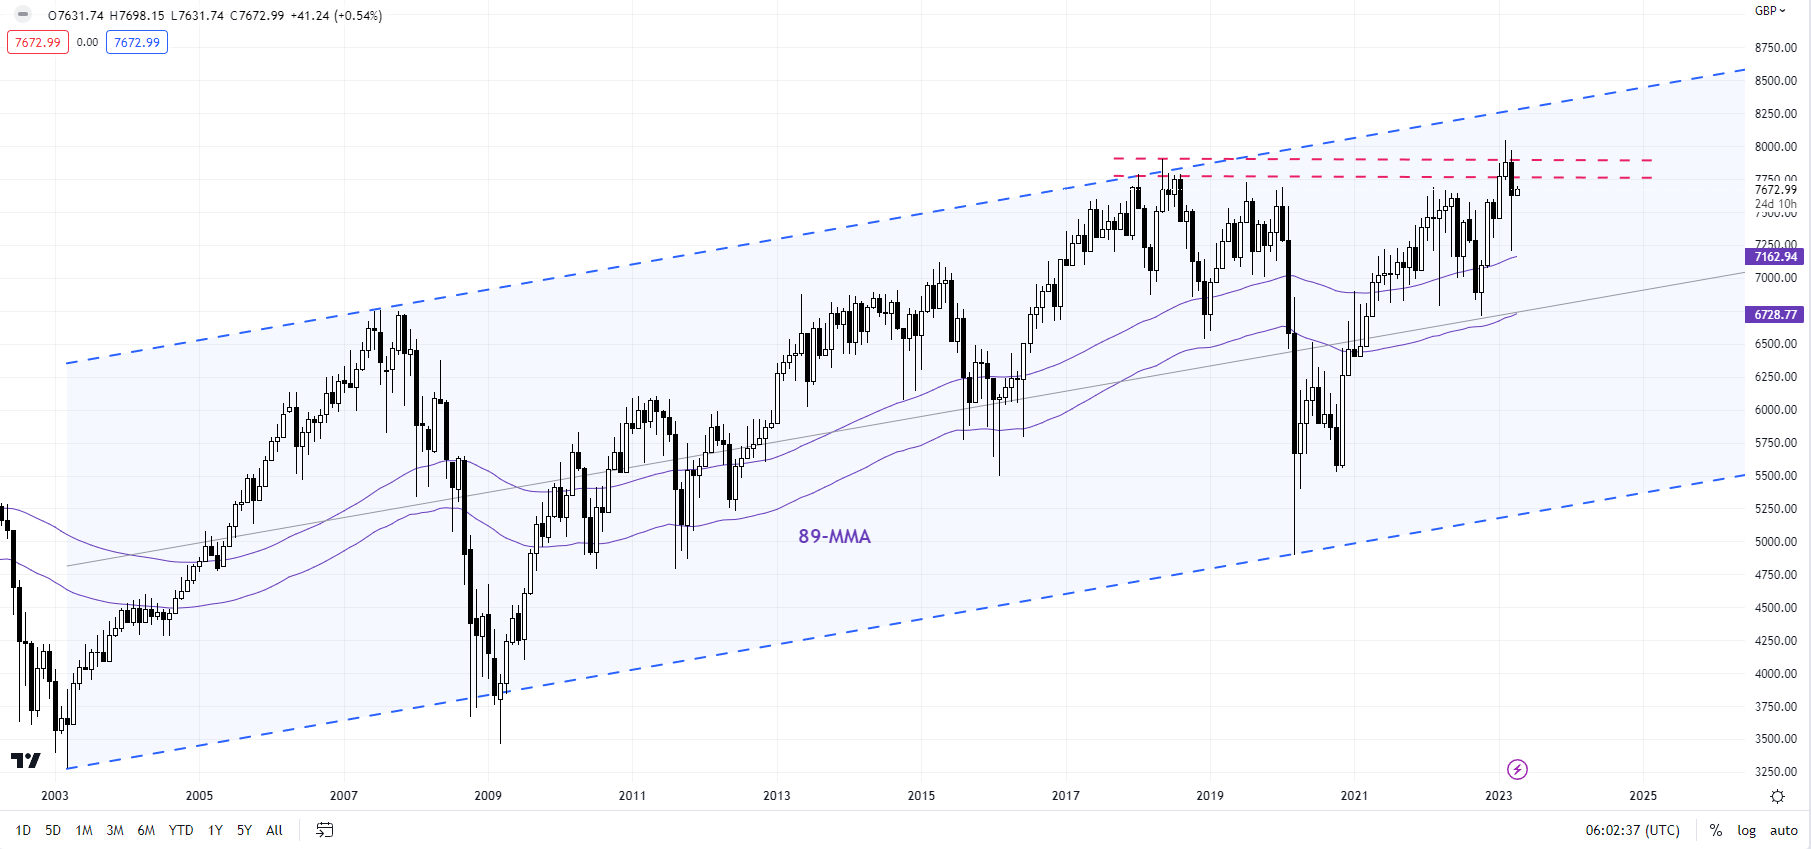
Chart Created Using TradingView
This follows a sharp retreat from near major hurdle at the 2018 high of 7904, pushing the index down toward the 200-day moving average. The rebound since is corrective and FTSE would need to clear the immediate barriers around 7650-7710 for the uptrend to resume. For the moment, though, the bar is rather high for the UK benchmark index to continue its two-week-long rebound.
Trade Smarter - Sign up for the DailyFX Newsletter
Receive timely and compelling market commentary from the DailyFX team
--- Written by Manish Jaradi, Strategist for DailyFX.com
--- Contact and follow Jaradi on Twitter: @JaradiManish


