


US Dollar, Euro, EUR/USD - Technical Outlook:
- EUR/USD has run into significant resistance.
- The risk of a minor retreat is growing.
- What are the signposts to watch?

EUR/USD TECHNICAL FORECAST – SLIGHTLY BEARISH
The recent stalling of momentum is a sign that the Euro’s rally against the US Dollar is showing signs of fatigue, pointing to the risk of an imminent retreat.
EUR/USD has run into major resistance: the 200-day moving average, coinciding with the August high of 1.0370, near the January 2017 low of 1.0340. The 14-day Relative Strength Index is turning around, just as spot tests key resistance. The lack of ‘force’ is a signal that EUR/USD may not be ripe just yet for a break higher.
EUR/USD Daily Chart
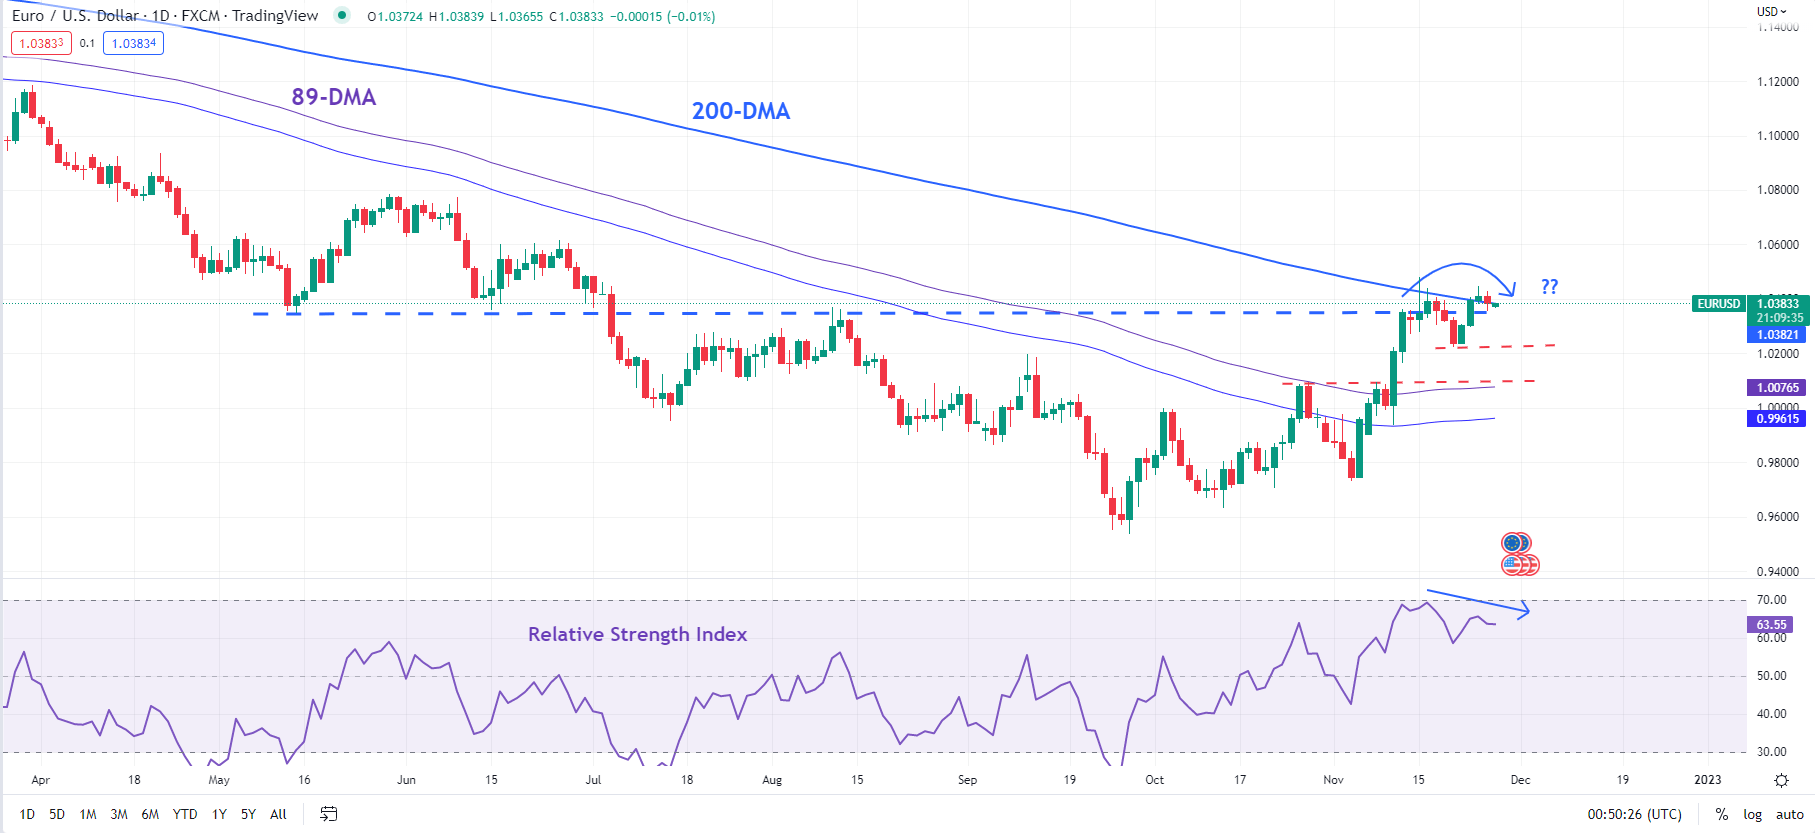
Chart Created Using TradingView
Furthermore, spot has failed to move toward the top end of a rising pitchfork channel in play since October – it has moved to a ‘lower gear’, that is, the bottom part of the channel, indicating fading upward momentum. Indeed, it could retreat slightly in the near term. The risk of retreat was highlighted last week, but the drop then turned out to be shallow.
Any pullback from current levels could push the pair to immediate support at the November 21 low of 1.0225, which could restrict the downside for now. Any break below 1.0225 would trigger a minor double top (the November highs), implying a possible fall toward parity, roughly around a quite-strong cushion at the end-October high of 1.0095, near the 89-day moving average.
EUR/USD 240-minutes Chart
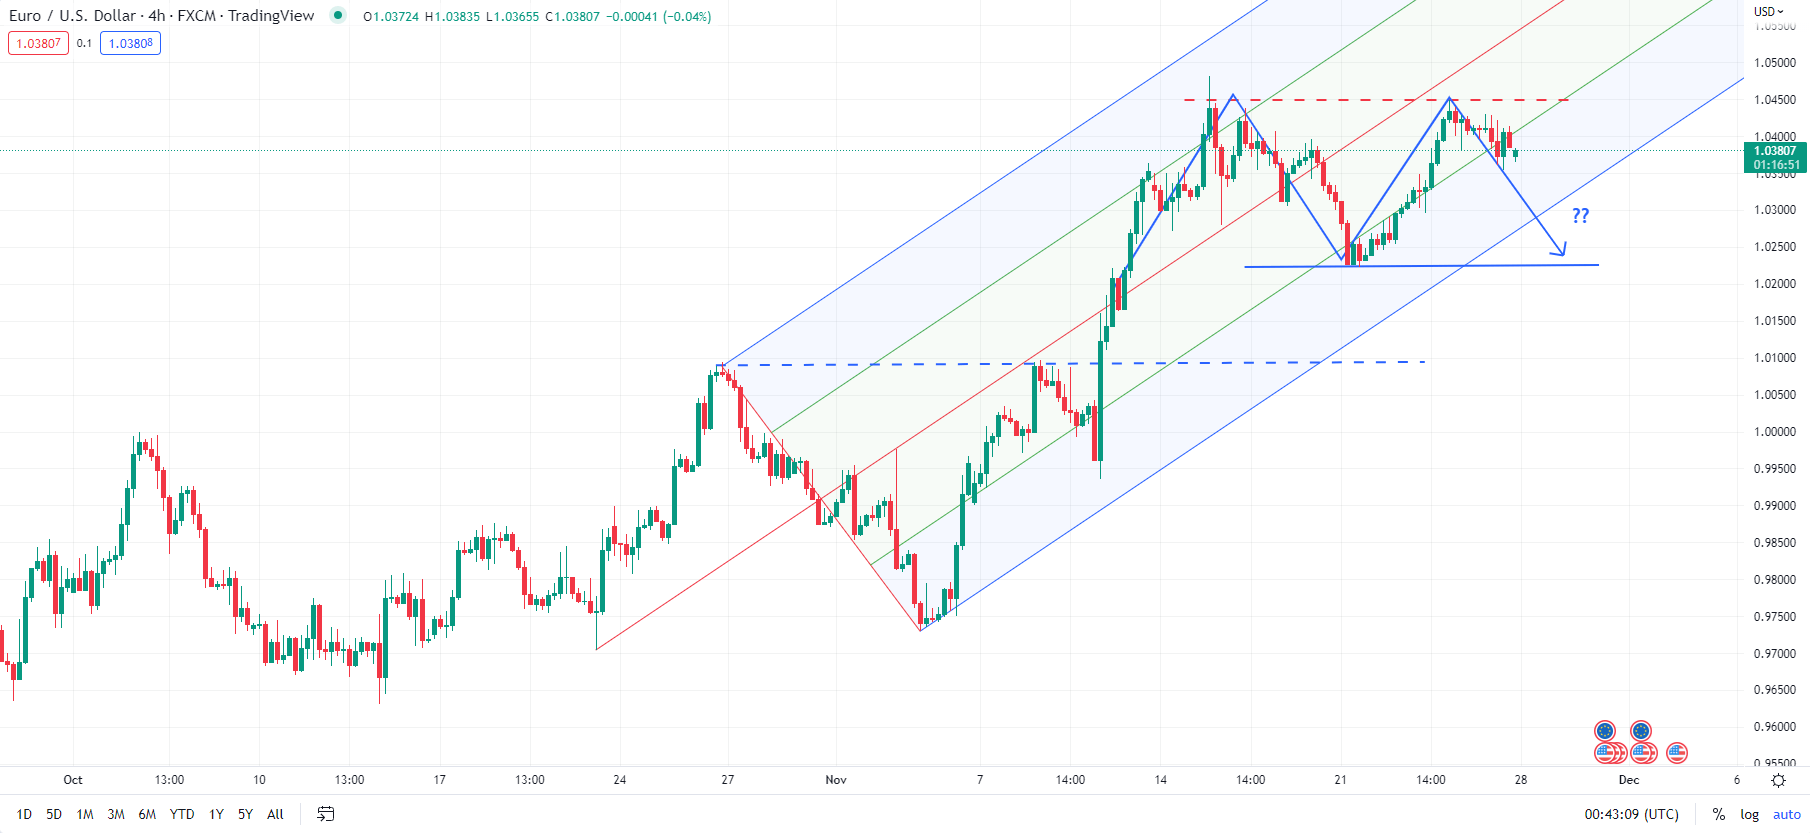
Chart Created Using TradingView
The three-month moving average recently turned into support from resistance – EUR/USD has stayed under this barrier since mid-2021. Hence, if the two-month rally has legs, the pair needs to stay above the moving average for another push higher. A failure to do so would raise the odds that medium-term downward pressure is returning.
After creating a 20-year low in September, EUR/USD’s 8% gains since is a reflection that the downward pressure has eased somewhat in the near term. However, it may be too soon to conclude that the worst is over for the single currency. A break above the 200-day moving average would be a sign that the medium-term bearish outlook is changing. A decisive push higher could pave the way toward 1.0615 (the 38.2% retracement of the 2021-2022 slide).

--- Written by Manish Jaradi, Strategist for DailyFX.com


