


Dow Jones, S&P 500, Retail Trader Positioning, Technical Analysis – IGCS Equities Update
- Dow Jones and S&P 500 have been rising in recent weeks
- Retail traders have been increasing net-short Wall Street bets
- This hints at further gains, but prices face key technical obstacles

Equities on Wall Street have been aiming higher in recent weeks amid fading bank sector woes as markets focus on a pivot from the Federal Reserve. In response, retail traders have increased downside exposure in the Dow Jones and S&P 500. This can be seen by looking at IGCS, which tends to function as a contrarian indicator. With that in mind, could further upside be in store for stocks?
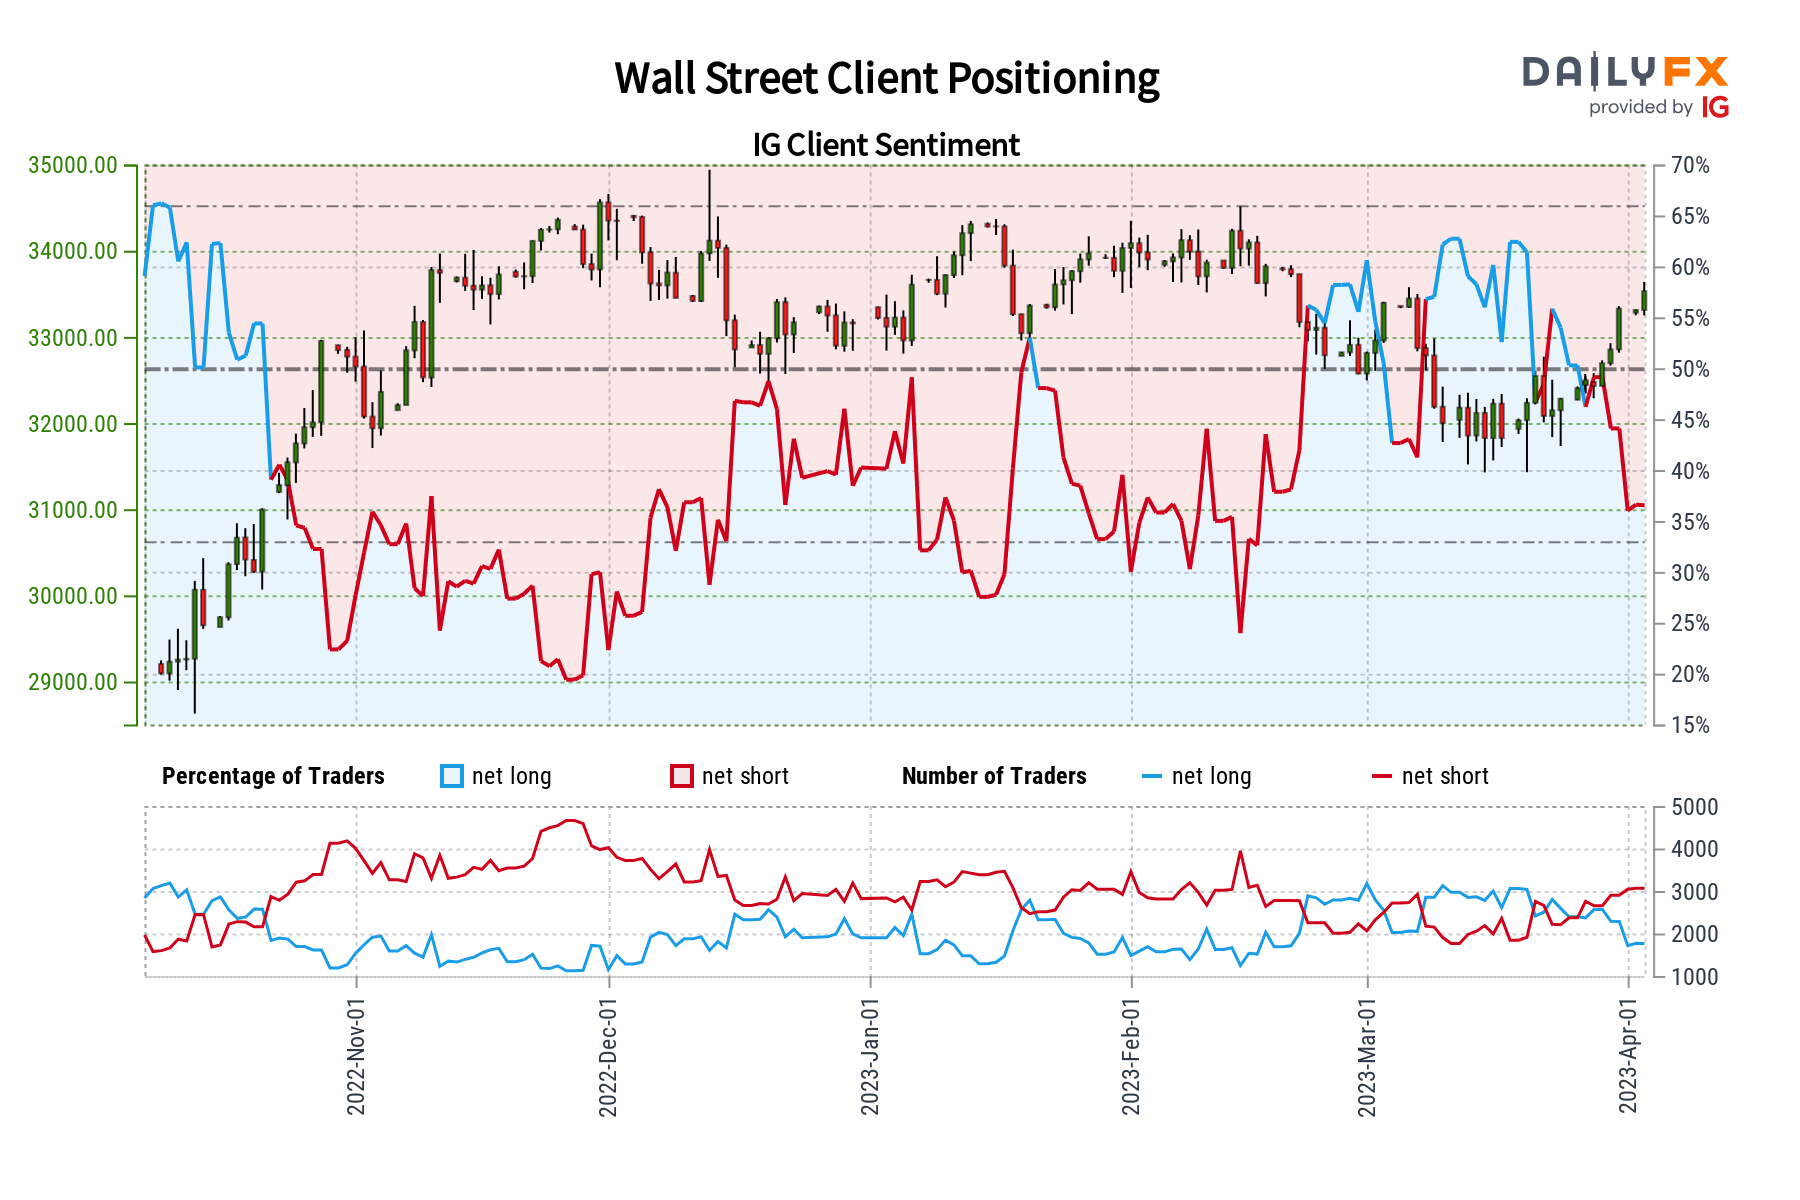
Dow Jones Sentiment Outlook - Bullish
According to IGCS, about 35% of retail traders are net-long the Dow Jones. Since most traders are biased to the downside, this hints prices may continue rising. This is as downside exposure has increased by 18.26% and 23.97% compared to yesterday and last week, respectively. With that in mind, the combination of overall positioning and recent changes offers a stronger bullish contrarian trading bias.
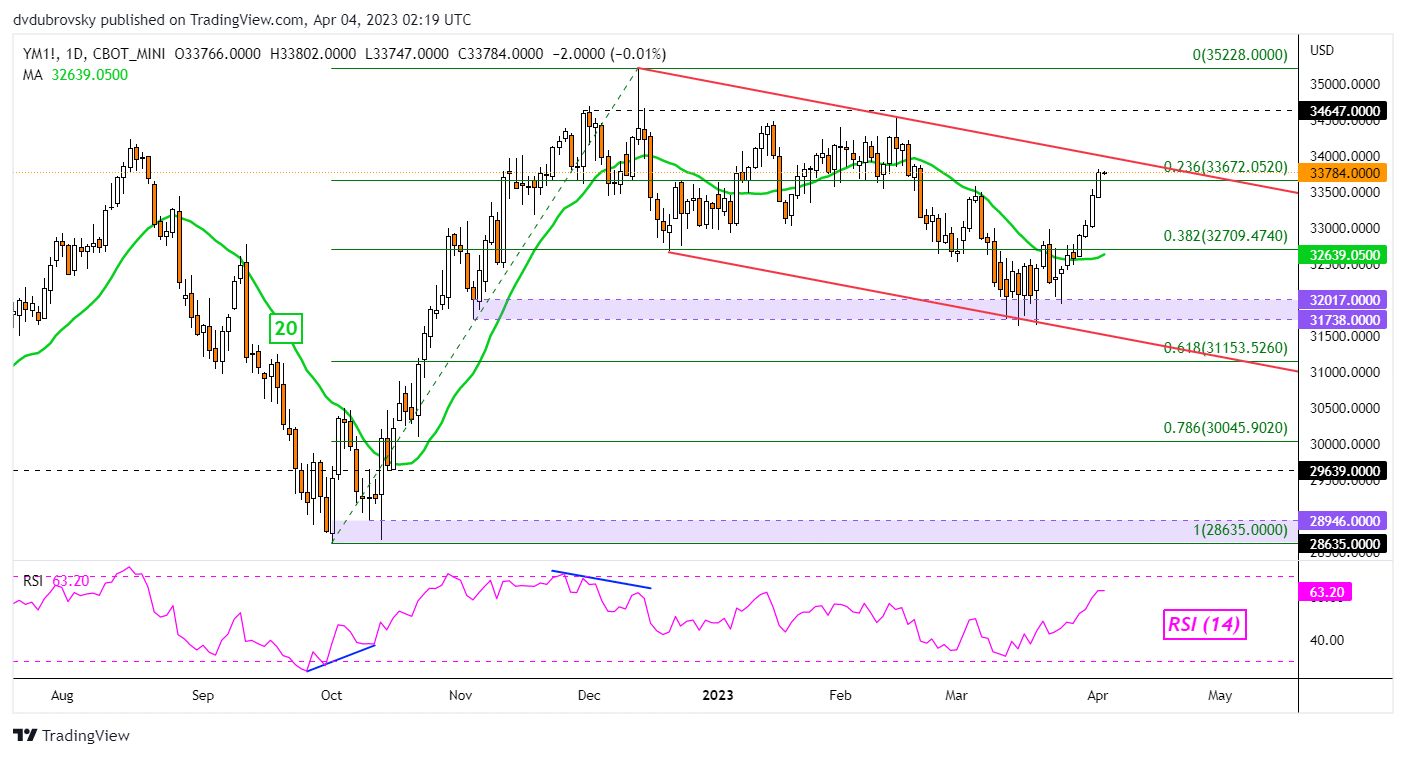
Dow Jones Technical Analysis
The Dow Jones continues to trade within the boundaries of a falling channel since December. Following the most recent bounce off the floor in early March, prices are now sitting just under the ceiling. As such, the latter is immediate resistance. Breaking higher would overturn the medium-term downside trajectory, exposing highs from February. Otherwise, a turn lower places the focus on the 38.2% Fibonacci retracement level at 32709.
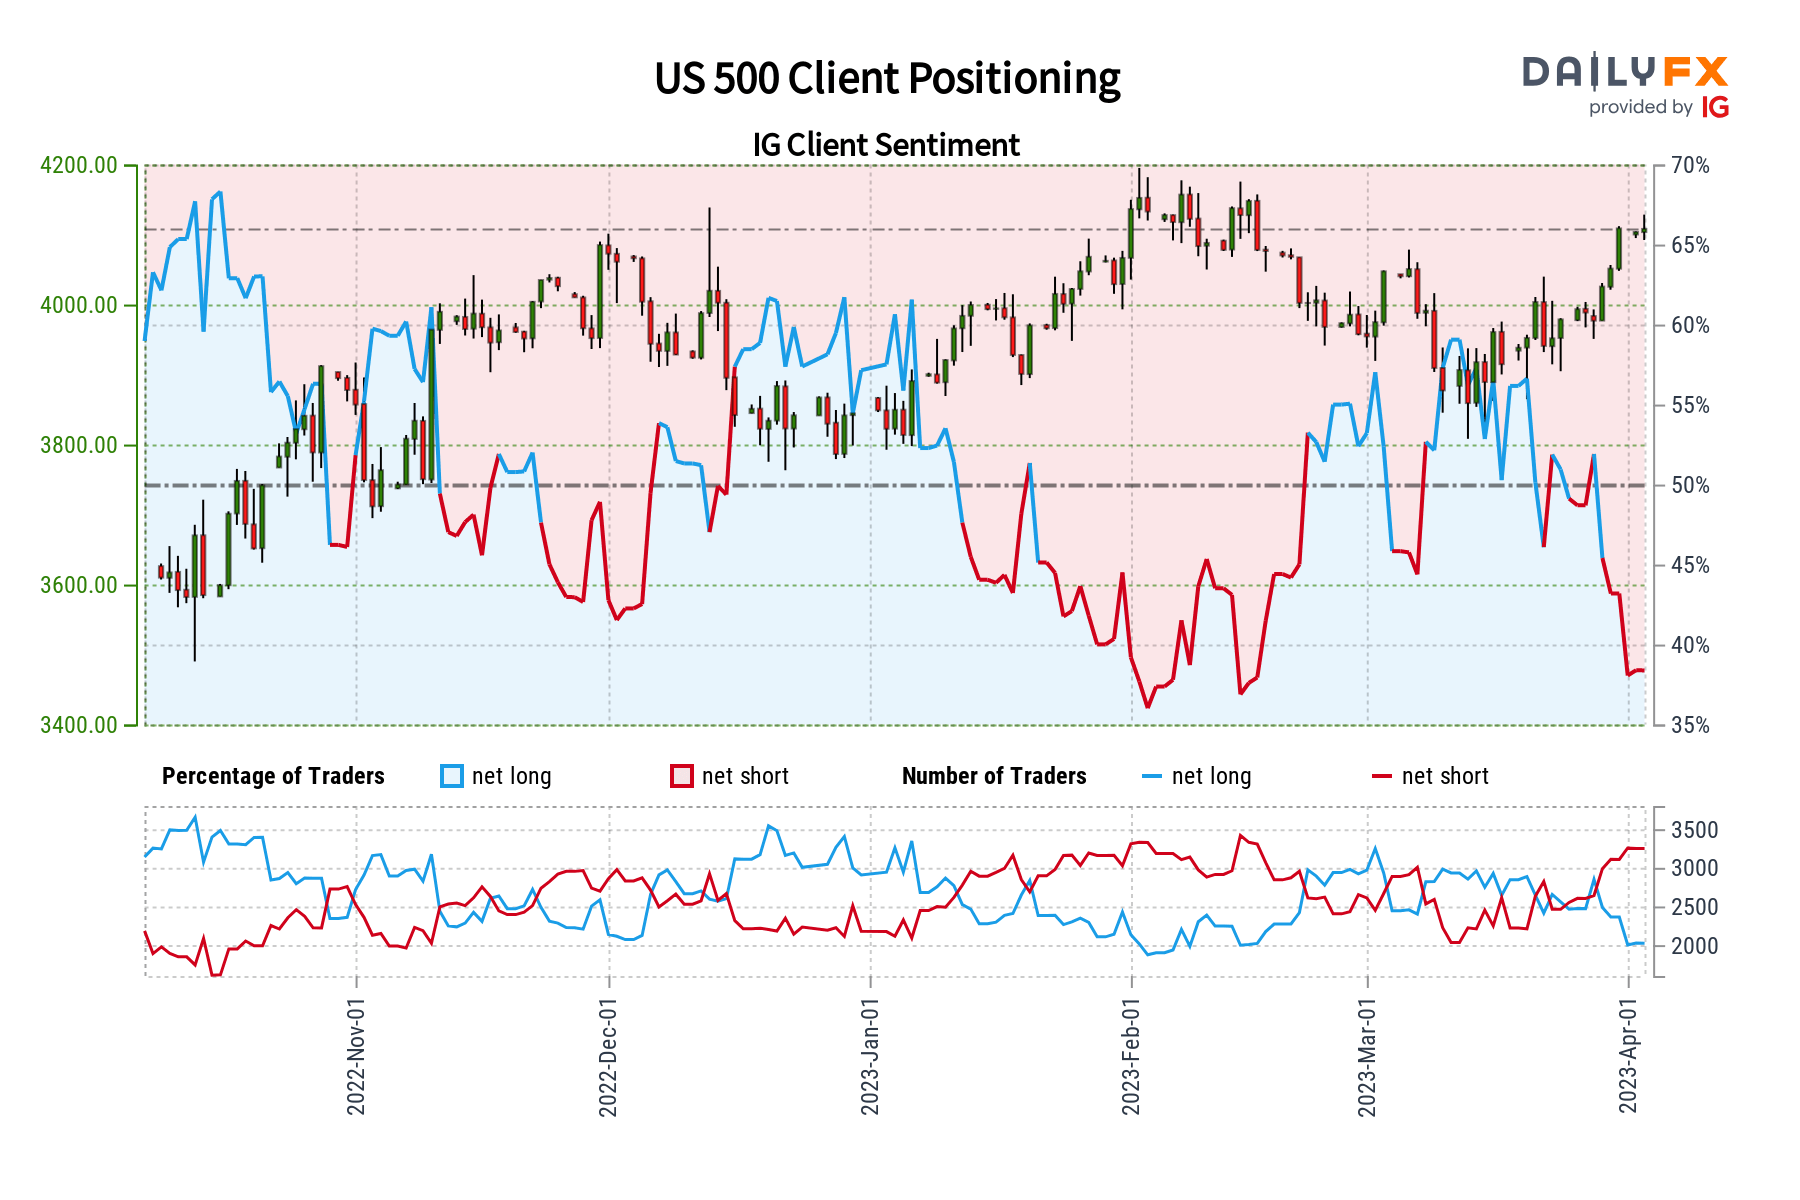
S&P 500 Sentiment Outlook - Bullish
According to IGCS, about 39% of retail traders are net-long the S&P 500. Since most of them are biased lower, this hints prices may continue rising. Meanwhile, downside exposure increased by 7.49% and 24.55% compared to yesterday and last week, respectively. With that in mind, the combination of current sentiment and recent shifts in positioning produces an increasingly bullish contrarian trading bias.

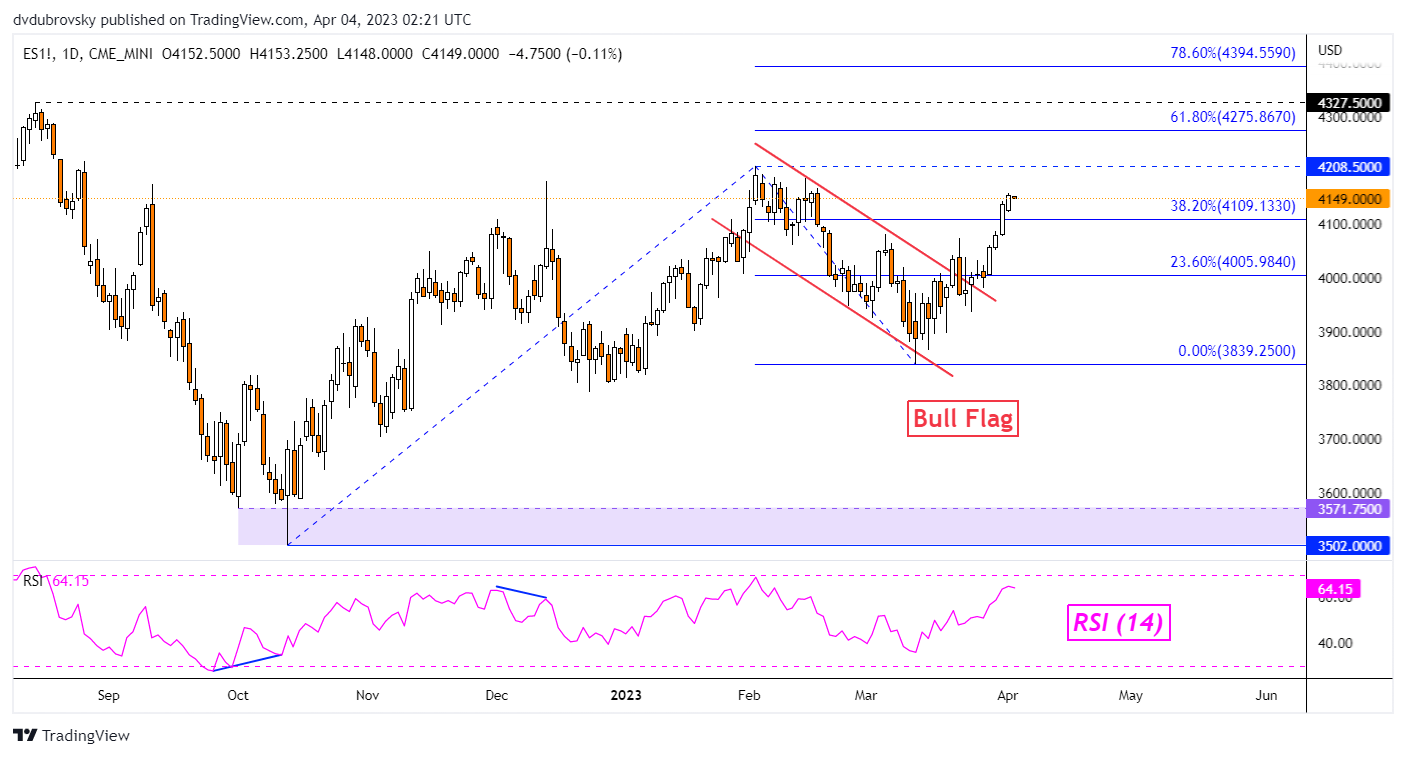
S&P 500 Technical Analysis
The S&P 500 continues its near-term trajectory higher after breaking above a Bull Flag chart formation. This is opening the door to a revisit of the January high at 4208. The latter is immediate resistance. Clearing this point would offer an increasingly bullish technical outlook. As it stands, the setting remains neutral, with immediate support at the 38.2% Fibonacci extension level at 4109. Clearing the latter would open the door to falling back to the March low.
--- Written by Daniel Dubrovsky, Senior Strategist for DailyFX.com
To contact Daniel, follow him on Twitter:@ddubrovskyFX


