


Dow Jones, S&P 500, Retail Trader Positioning, Technical Analysis – IGCS Equities Update
- In recent days, the Dow Jones and S&P 500 have been falling
- Retail traders responded by increasing their bearish exposure
- This is a sign that further losses may be in store in days ahead

In recent days, equities on Wall Street have been aiming lower, with the Dow Jones and S&P 500 touching their lowest points since the end of March. In response, retail traders have been increasing their upside exposure. This can be seen by looking at IG Client Sentiment (IGCS), which often functions as a contrarian indicator. Is this a sign that further pain might be in store for stock markets?
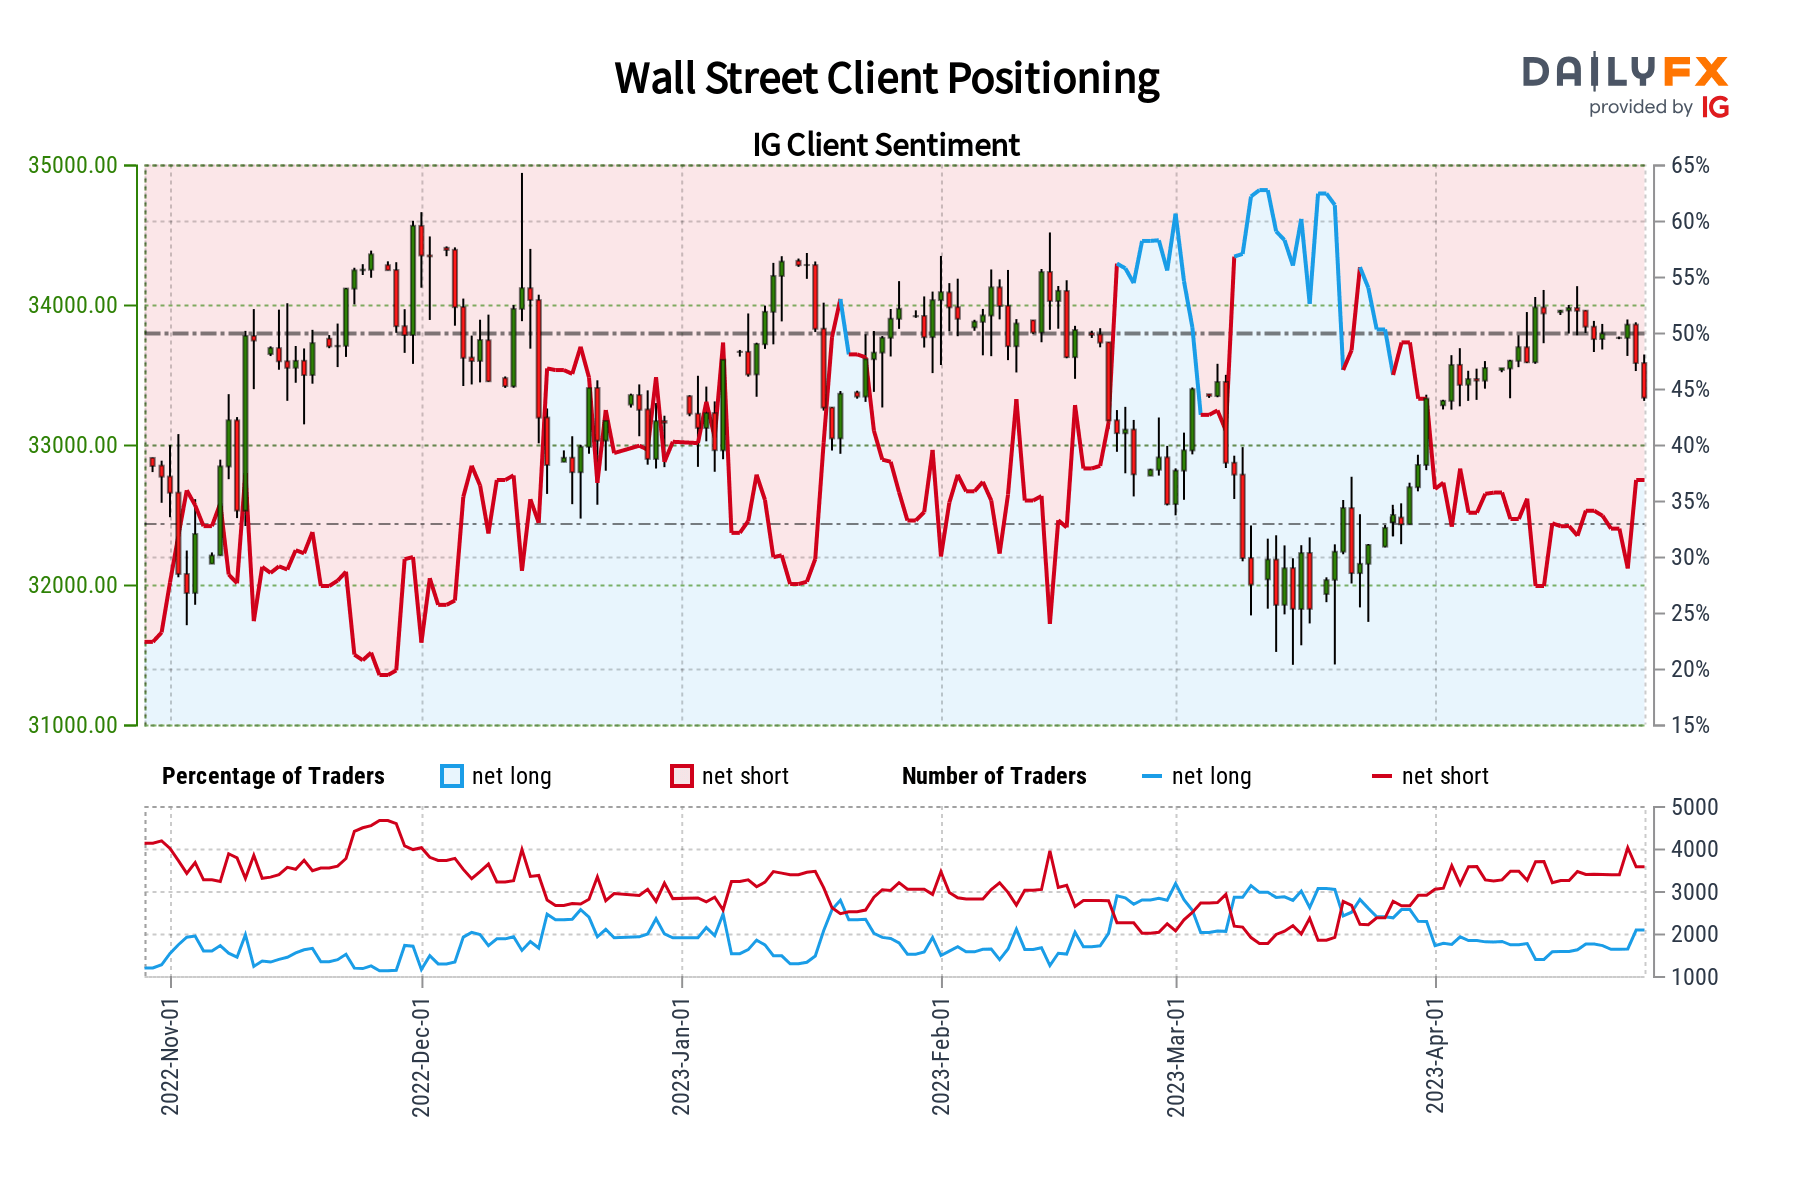
Dow Jones Sentiment Outlook - Bearish
According to IGCS, about 37% of retail traders are net-long the Dow Jones. Since most of them are still biased to the downside, this hints that prices may continue rising down the road. This is as upside exposure decreased by 1.59% compared to yesterday while increasing by 10.41% versus a week ago. Recent changes in exposure warn that the Dow Jones may extend its recent slide.
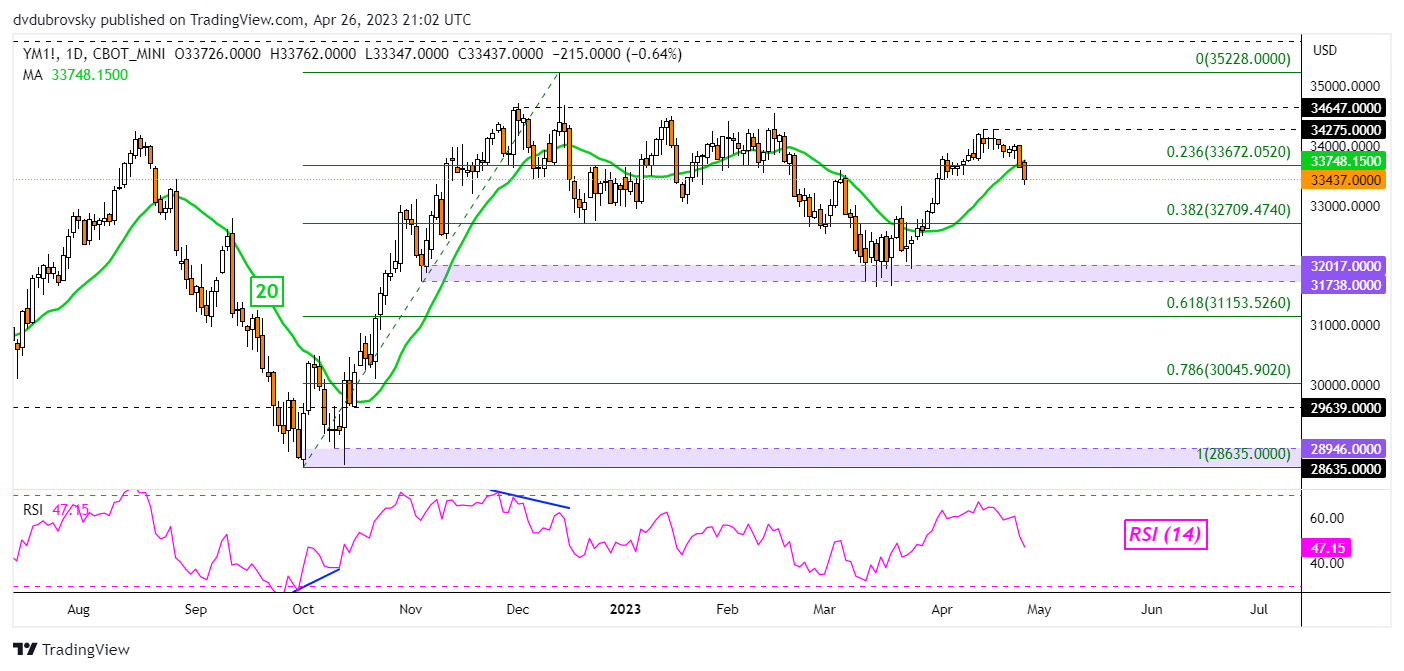
Dow Jones Technical Analysis
On the daily chart, the Dow Jones has broken under the 20-day Simple Moving Average (SMA). This follows a series of cautious losses since the beginning of April. Now, the 38.2% Fibonacci retracement level has been exposed at 32709. Beyond that sits the key 31738 – 32017 support zone. A turn back above the SMA places the focus on the April high at 34275.
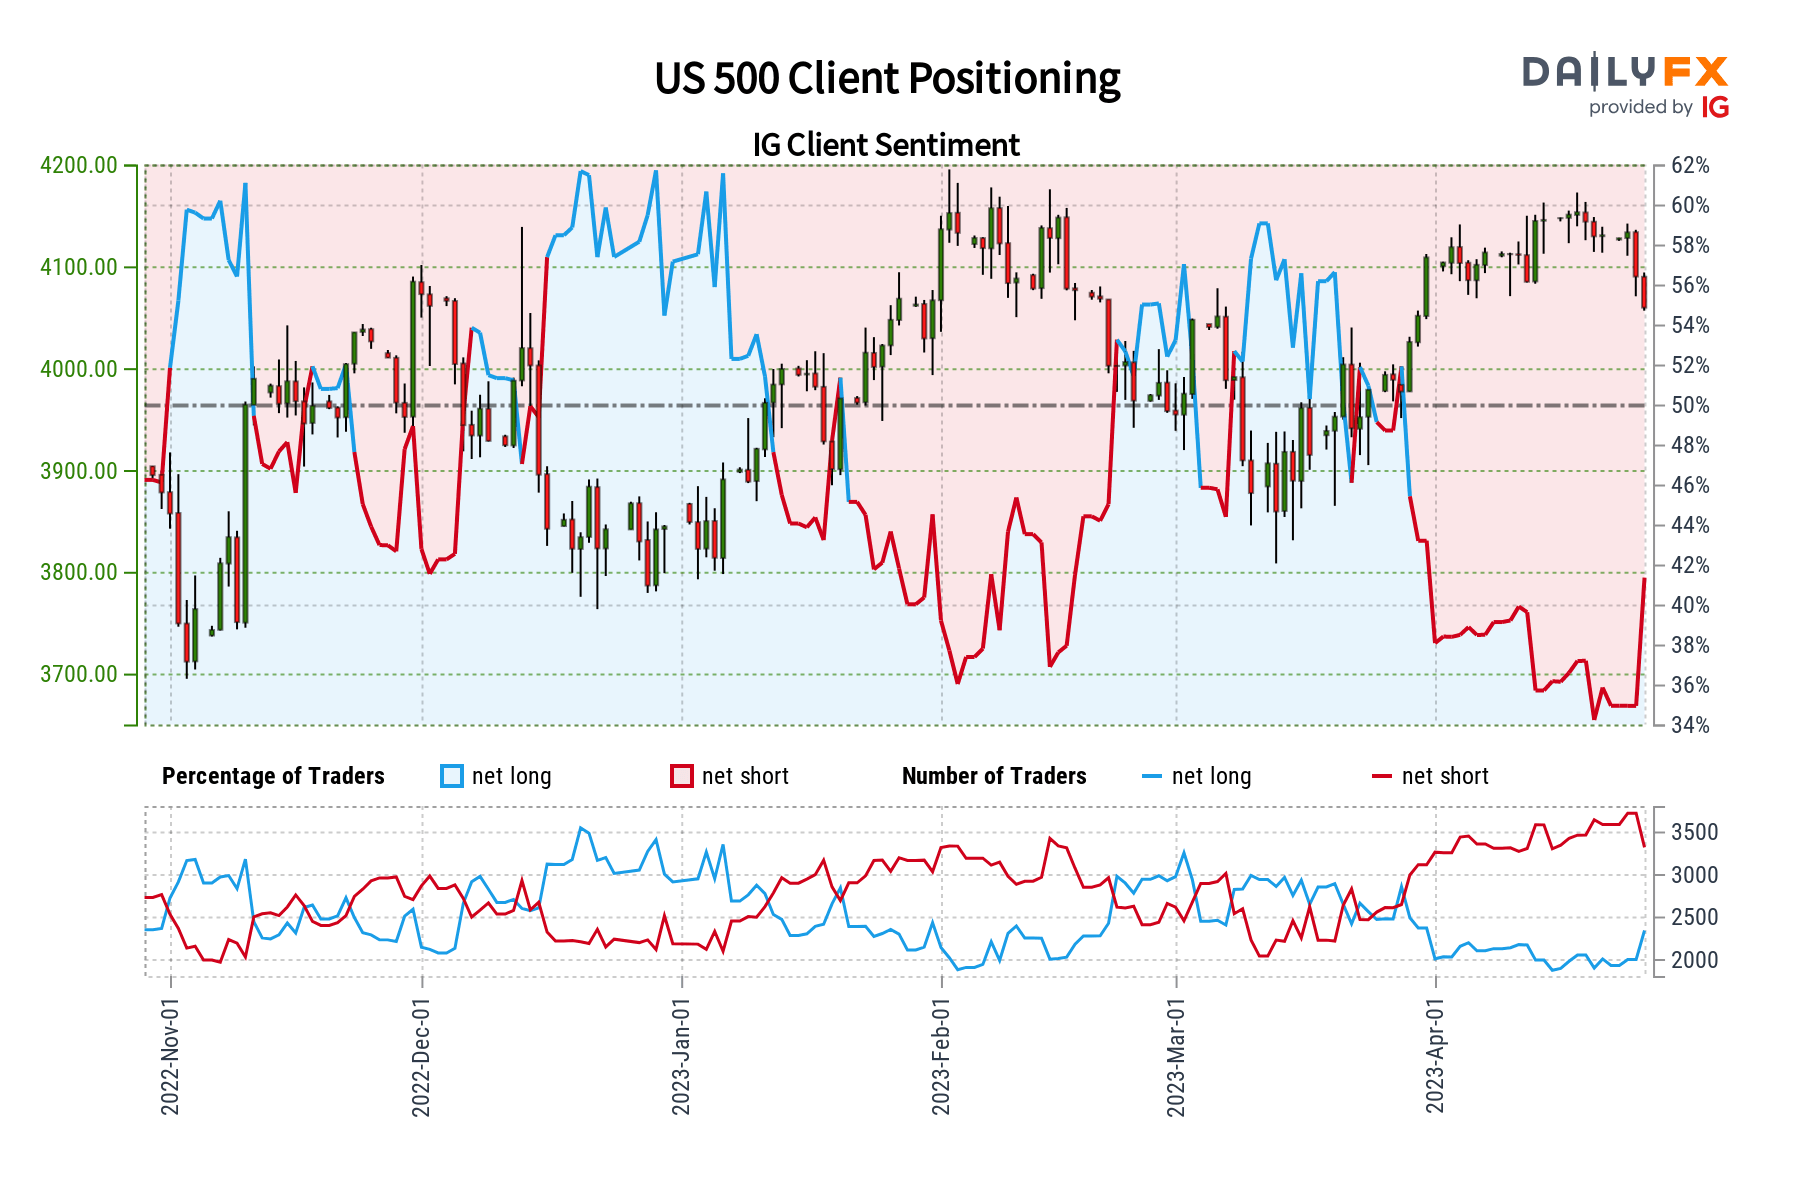
S&P 500 Sentiment Outlook - Bearish
According to IGCS, about 39% of retail traders are net-long the S&P 500. Since most traders are still biased lower, this hints that prices may continue rising down the road. But bearish exposure has decreased by 1.67% and 0.94% compared to yesterday and last week, respectively. With that in mind, recent changes in positioning warn that the current price trend may continue lower.

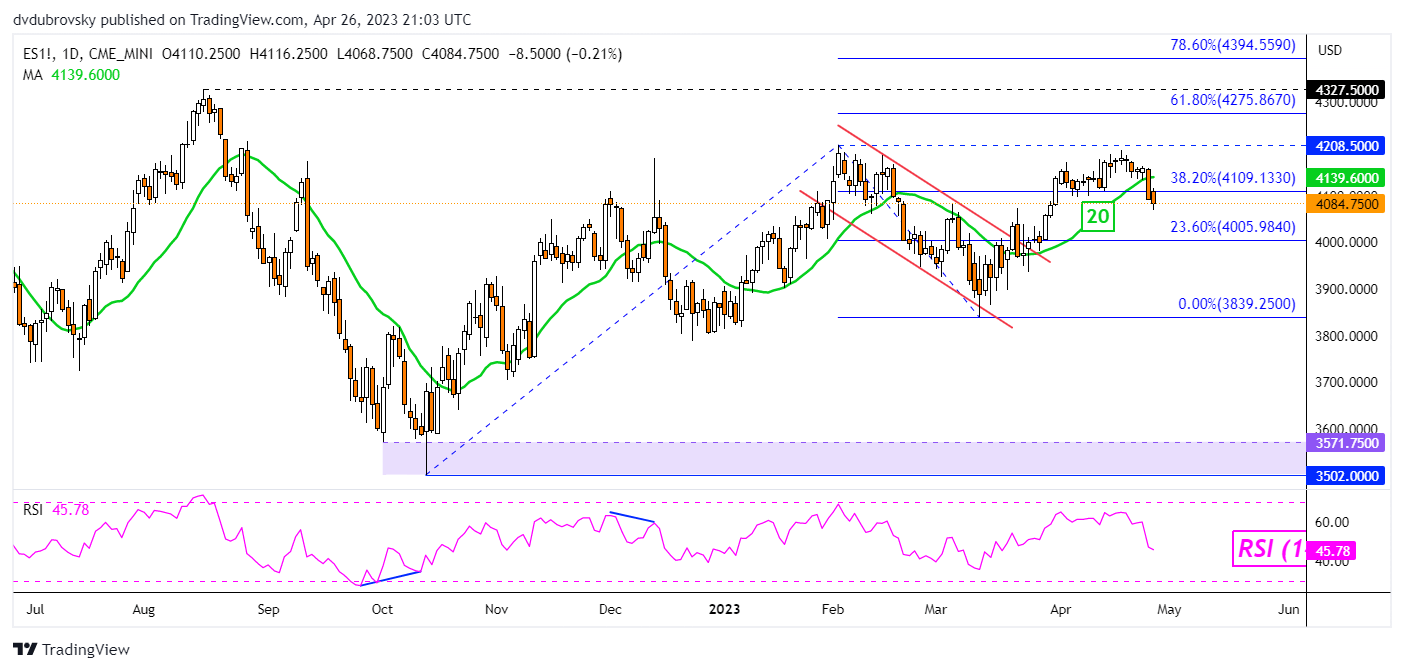
S&P 500 Technical Analysis
On the daily chart, the S&P 500 has confirmed a breakout under the 20-day SMA. That has also exposed the 23.6% Fibonacci extension level at 4005. Clearing the latter would open the door to revisiting the March low at 3839. Otherwise, in the event of a turn higher, further gains would place the focus on the April 18th high of 4164.
--- Written by Daniel Dubrovsky, Senior Strategist for DailyFX.com


