


Crude Oil Weekly Technical Outlook: Bullish
- Crude Oil prices rip higher after speculation of China easing lockdowns drive commodities higher
- US Crude (WTI) breaks $90 before running into resistance at historical support
- Brent Crude oil futures breach $95p/b – is $100 back on the cards?

China’s Potential Reopening Refuel Bullish Momentum as Oil Prices Rise
Crude oil prices are grinding higher after speculation of easing China lockdowns fueled a rally in commodities. As the news of a potential reopening of the world’s largest economy raised demand expectations, both WTI and Brent soared, driving oil futures higher.
With the fundamental backdrop providing a catalyst for bullish momentum, US Crude (WTI) futures rose on Friday, settling above $92.00.

From the daily chart below, the recent full-bodied candle indicates an aggressive move from buyers that allowed them to push through $90.00. With trendline support from the September low firming at around $88.00, an increase in bullish momentum could see prices rising back towards the $95.00 psychological handle.
Crude Oil (CL1!) Daily Chart
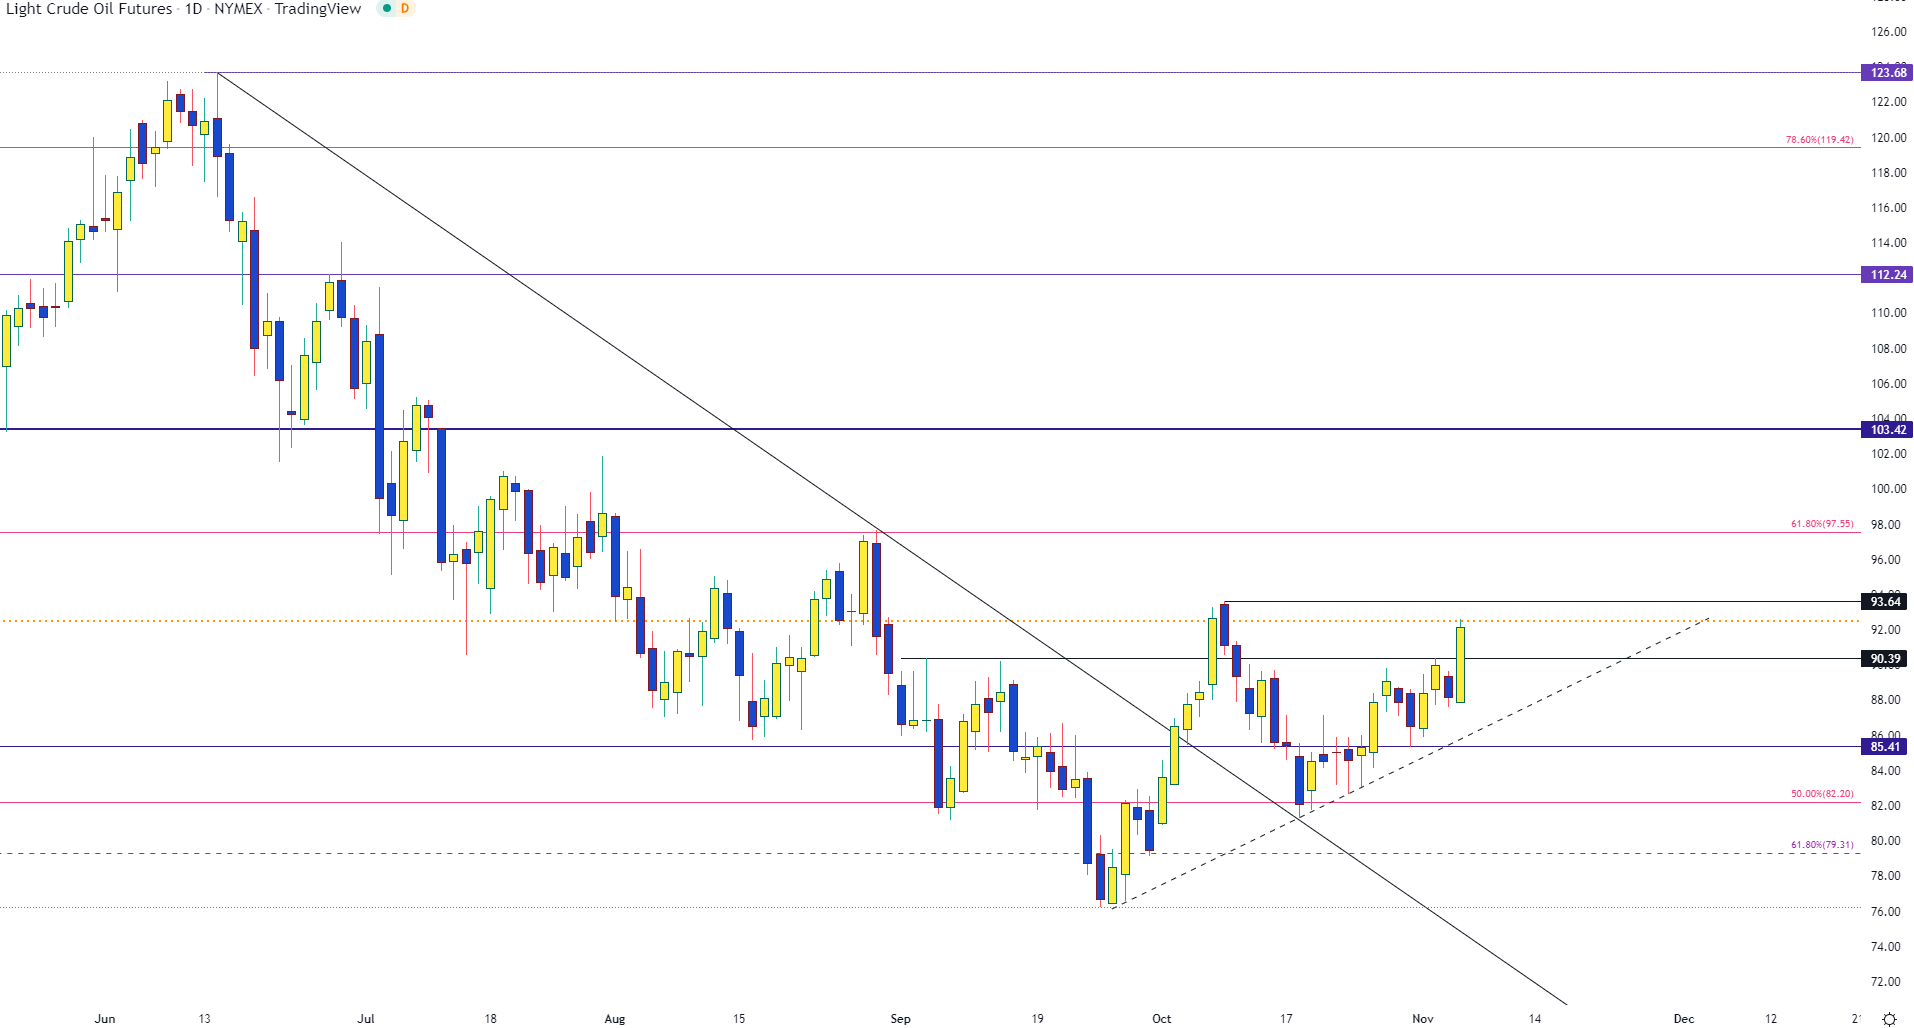
Chart prepared byTammy Da Costausing TradingView
After falling from the June high of 123.68, a four-month sell-off drove WTI to a September low of $76.5 before rising back above $80.00. As a strong rebound drove price action higher, the same technical levels that provided support for WTI in 2013 & 2014 are now assisting in limiting the upside move at $92.50.
With the October high of $93.64 and the $95.00 providing additional resistance, a move higher and a retest of $97.55 (the 61.8% Fibonacci of the 2001 – 2008 move) could drive WTI back to the big $100 mark.
Crude Oil (CL1!) Monthly Chart
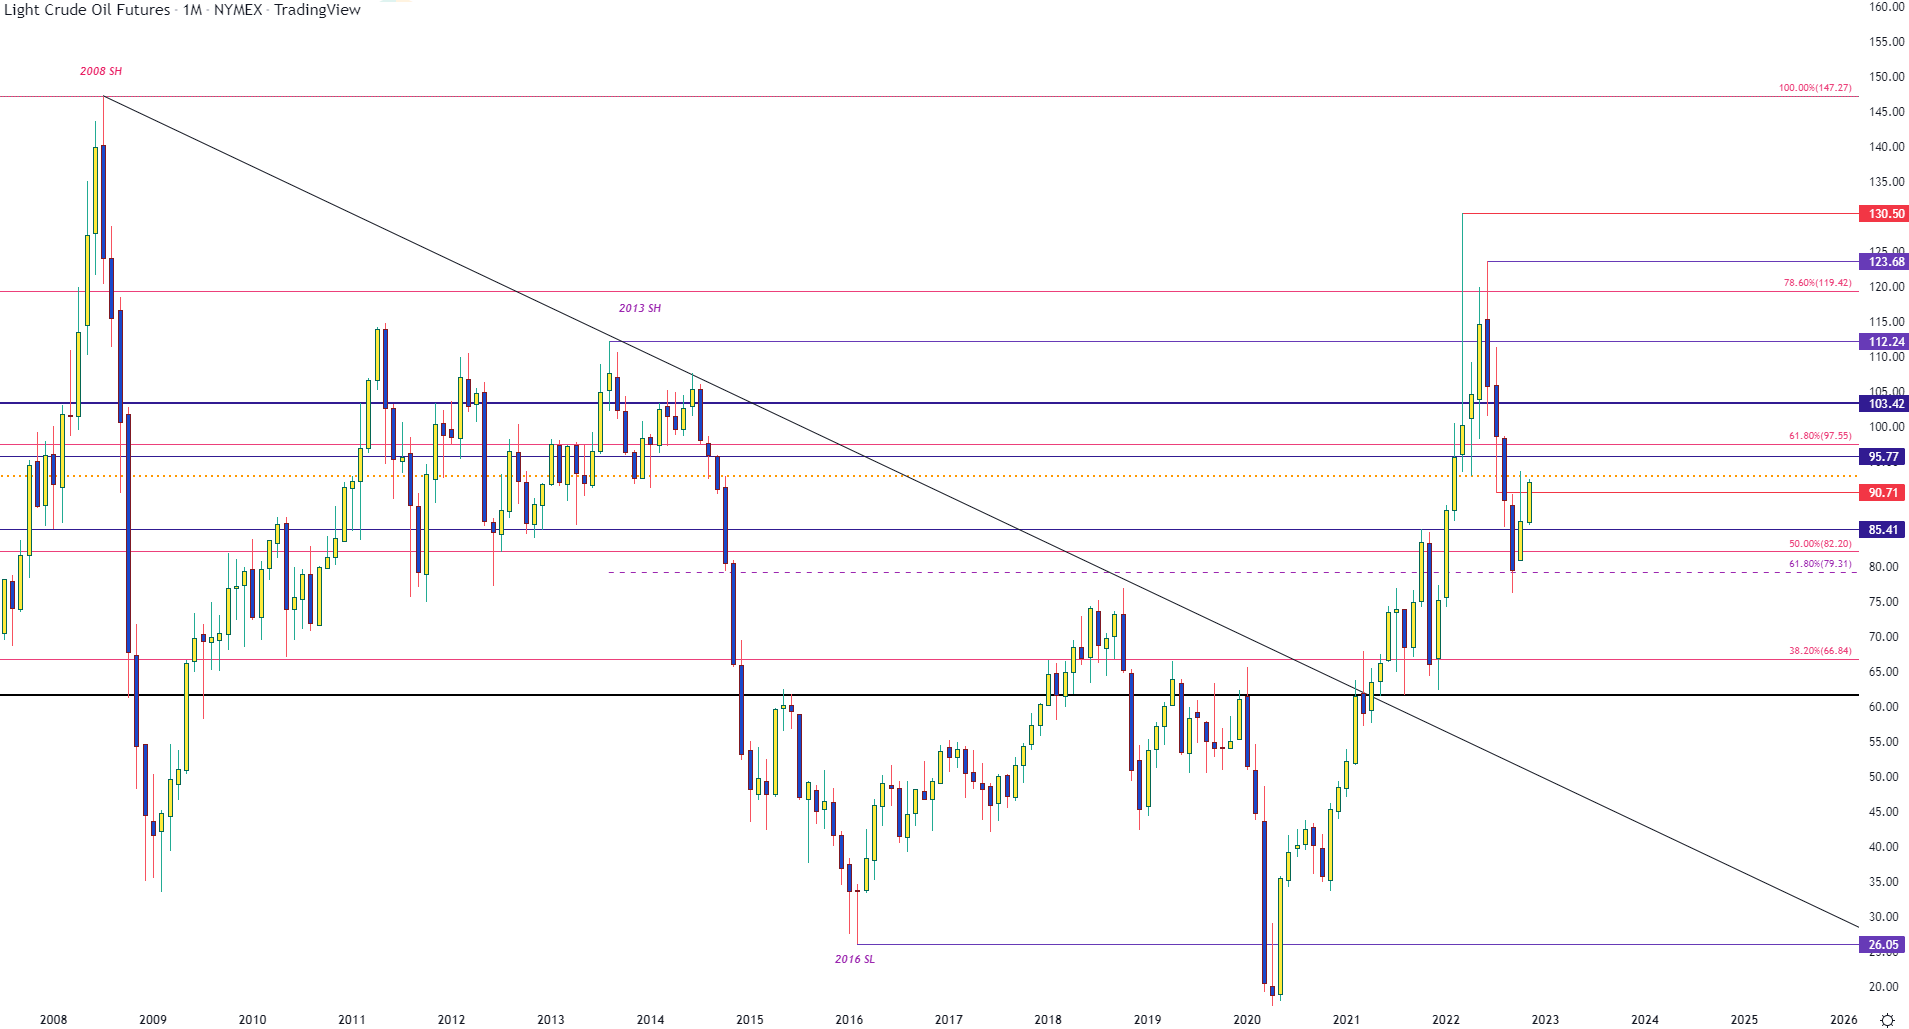
Chart prepared byTammy Da Costausing TradingView
Trade Smarter - Sign up for the DailyFX Newsletter
Receive timely and compelling market commentary from the DailyFX team
--- Written by Tammy Da Costa, Analyst for DailyFX.com
Contact and follow Tammy on Twitter: @Tams707


