


CRUDE OIL, WTI - Technical Outlook:
- Upward momentum in crude oil is improving.
- However, oil must deal with one more hurdle before it turns unambiguously bullish.
- What is the outlook and what are the key levels to watch?

Upward momentum in crude oil is improving following the breakout from a week-long sideways range as softening US price pressures bolstered the view that the Federal Reserve is nearing a pause in its hiking cycle. Still, oil must deal with one more hurdle before it turns unambiguously bullish.
US CPI rose 0.1% on-month in March, down from a 0.4% increase in February, and 5.0% on-year last month compared with 6.0% in February, cementing expectations that US interest rates are peaking, and weighing on the US dollar. Markets expect the Fed to hike one more time in May, before cutting rates to around 4.35% by the end of the year.
Crude Oil Daily Chart
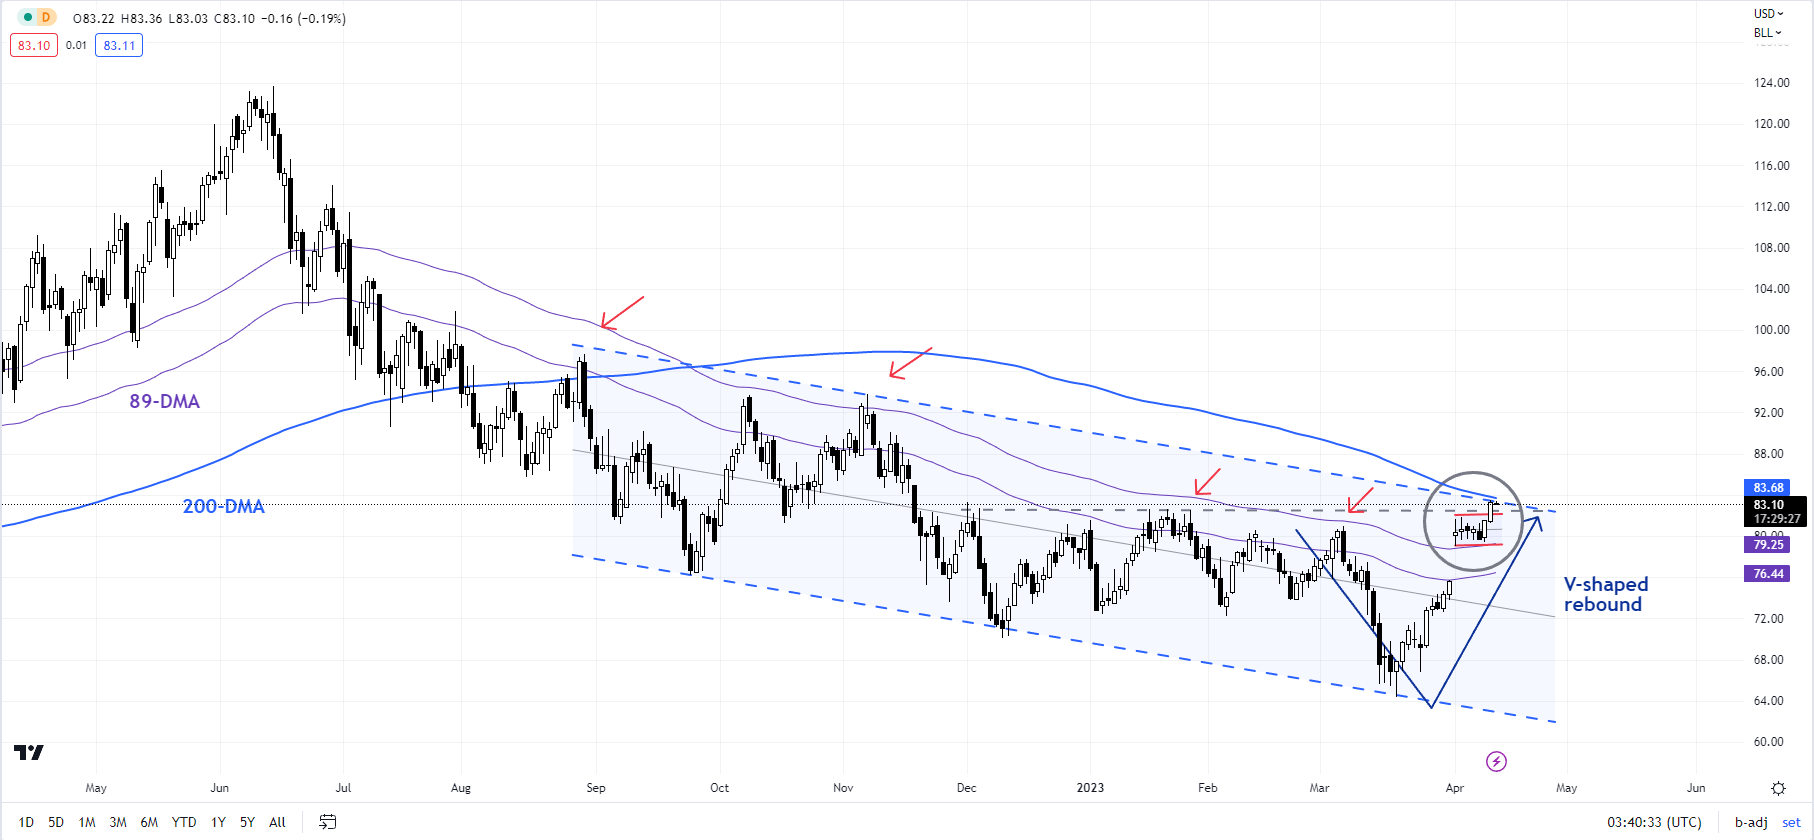
Chart Created by Manish Jaradi Using TradingView
Key focus is now on monthly reports from OPEC and International Energy Agency (IEA) due today and tomorrow respectively, which could shed light on oil demand and supply conditions. IEA’s executive director Fatih Birol said on Wednesday global oil market could see tightness in H2-2023, which could push oil prices higher.
Crude Oil Monthly Chart
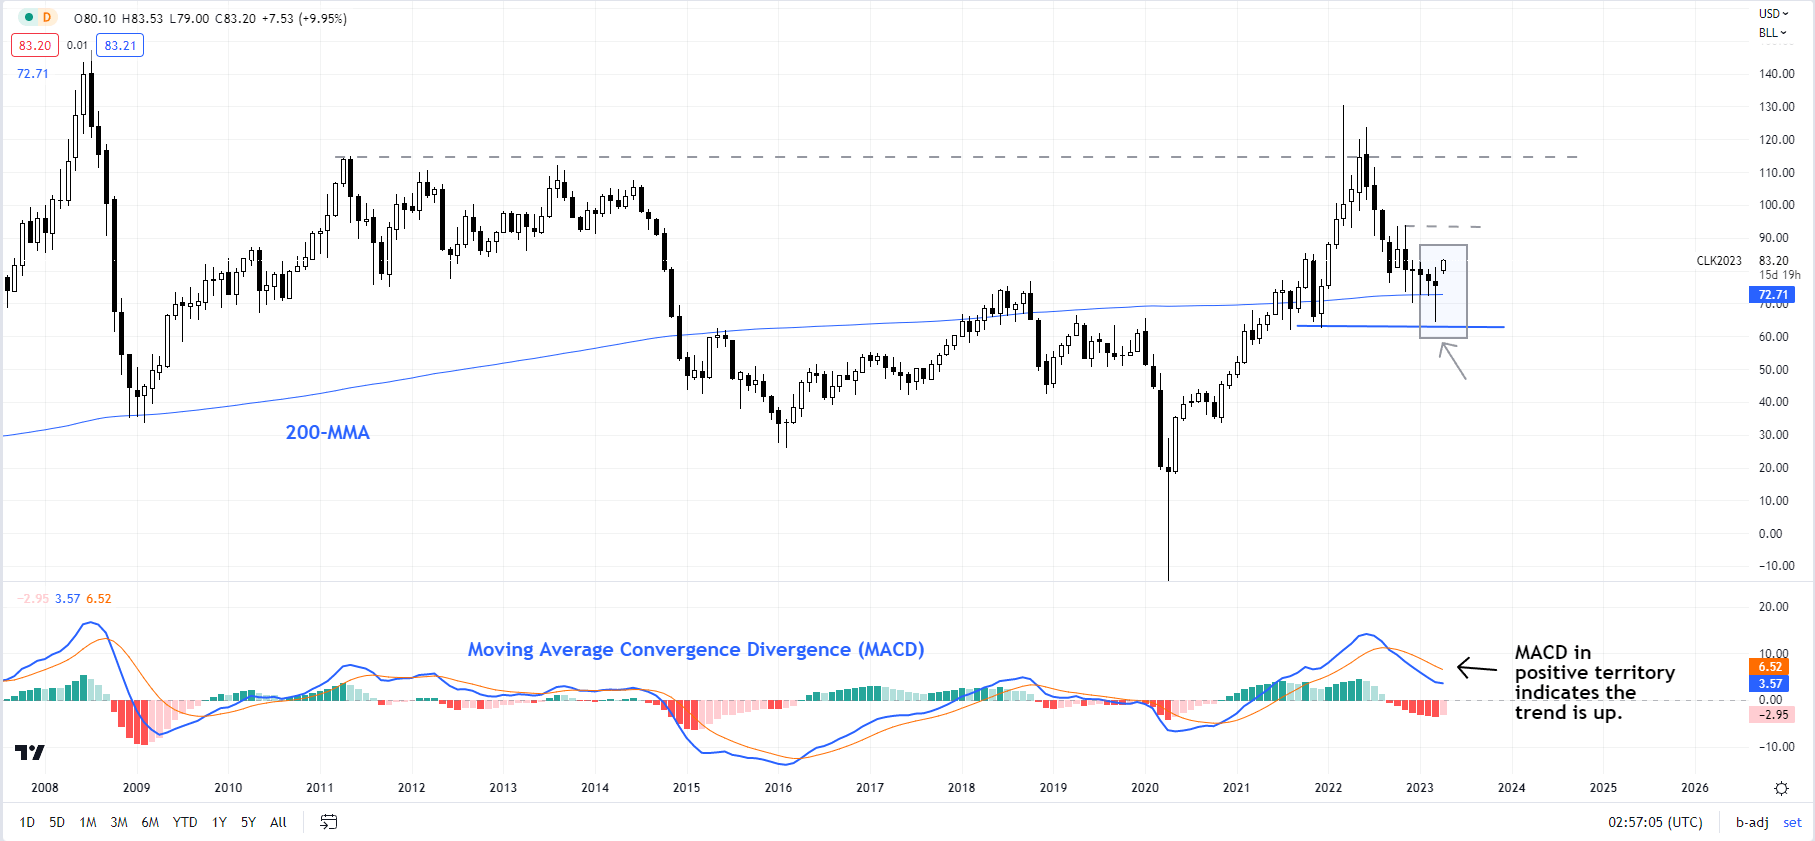
Chart Created by Manish Jaradi Using TradingView
On technical charts, crude oil this week held above a key floor at the upper edge of last weekend’s gap (at about 79.00), reaffirming the near-term bullish bias. Subsequent, it broke out of the week-long narrow range and crossed above fairly strong resistance on the 89-day moving average (rallies since late 2022 have been capped at the moving average).
Crude Oil 240-minute Chart
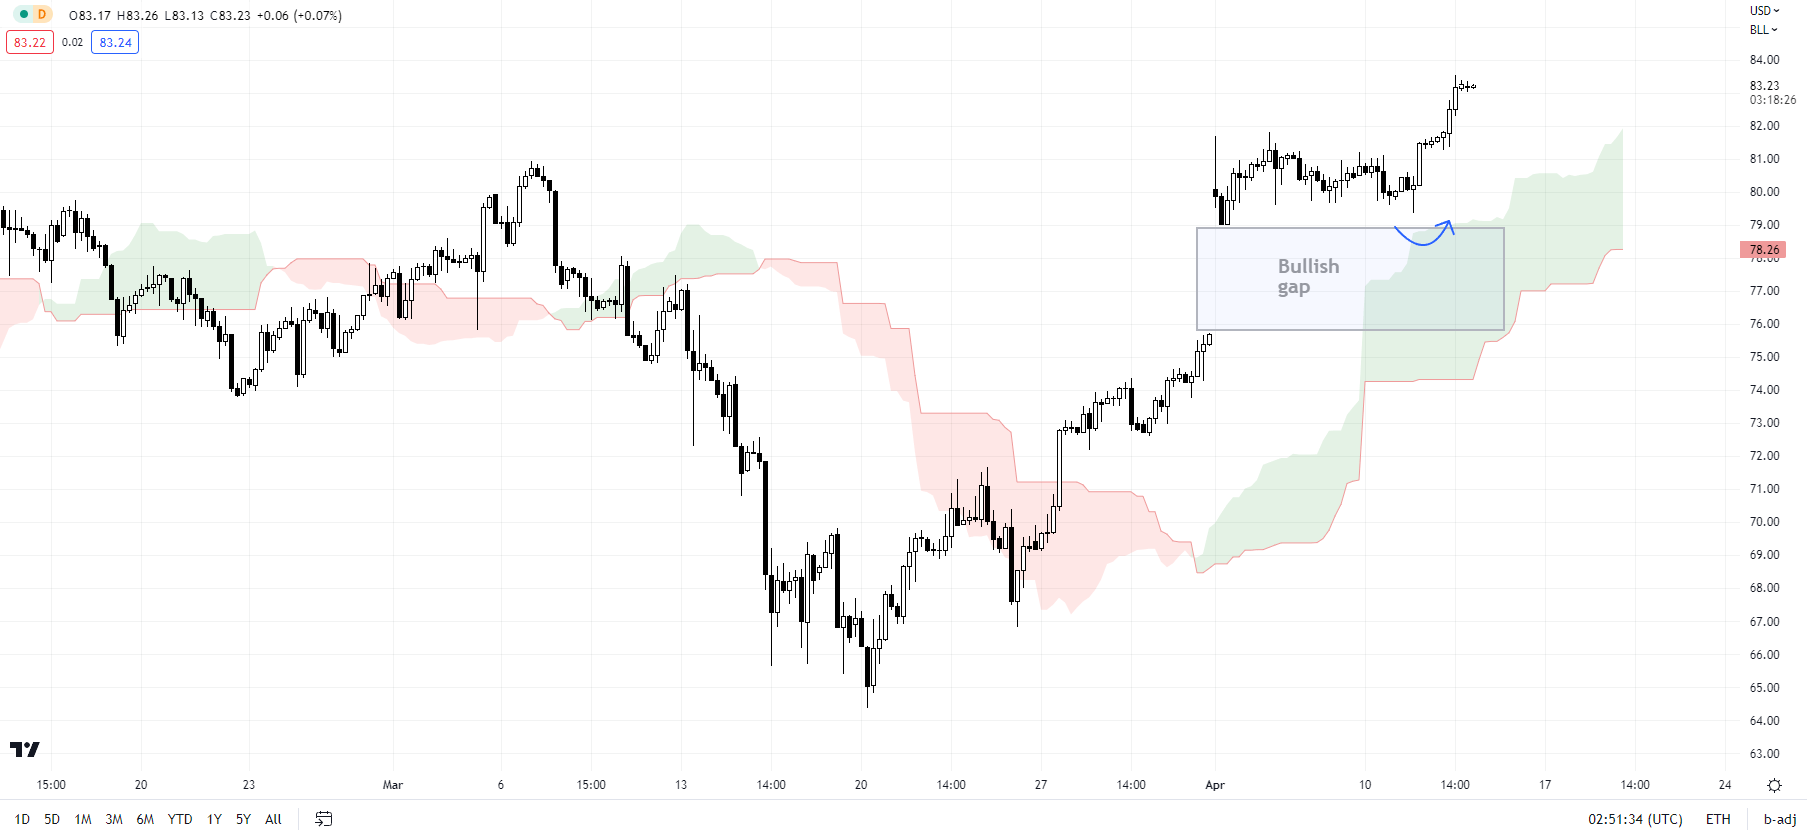
Chart Created by Manish Jaradi Using TradingView
It is now testing the 82.50-84.00 area, including the 200-day moving average and the January high. Oil’s rise above the March high of 81.00 on the monthly charts and the 89-day moving average has raised the odds of a move above 82.50-84.00. Such a break would imply that the ten-month-long downward pressure had faded, exposing the upside toward the November high of 93.75.
Trade Smarter - Sign up for the DailyFX Newsletter
Receive timely and compelling market commentary from the DailyFX team
--- Written by Manish Jaradi, Strategist for DailyFX.com
--- Contact and follow Jaradi on Twitter: @JaradiManish


