


Bond Market Highlights:
- 10s and 30s are tanking, with the long bond showing the most amount of stress
- The orderly decline is beginning to look disorderly and on that a low could be near

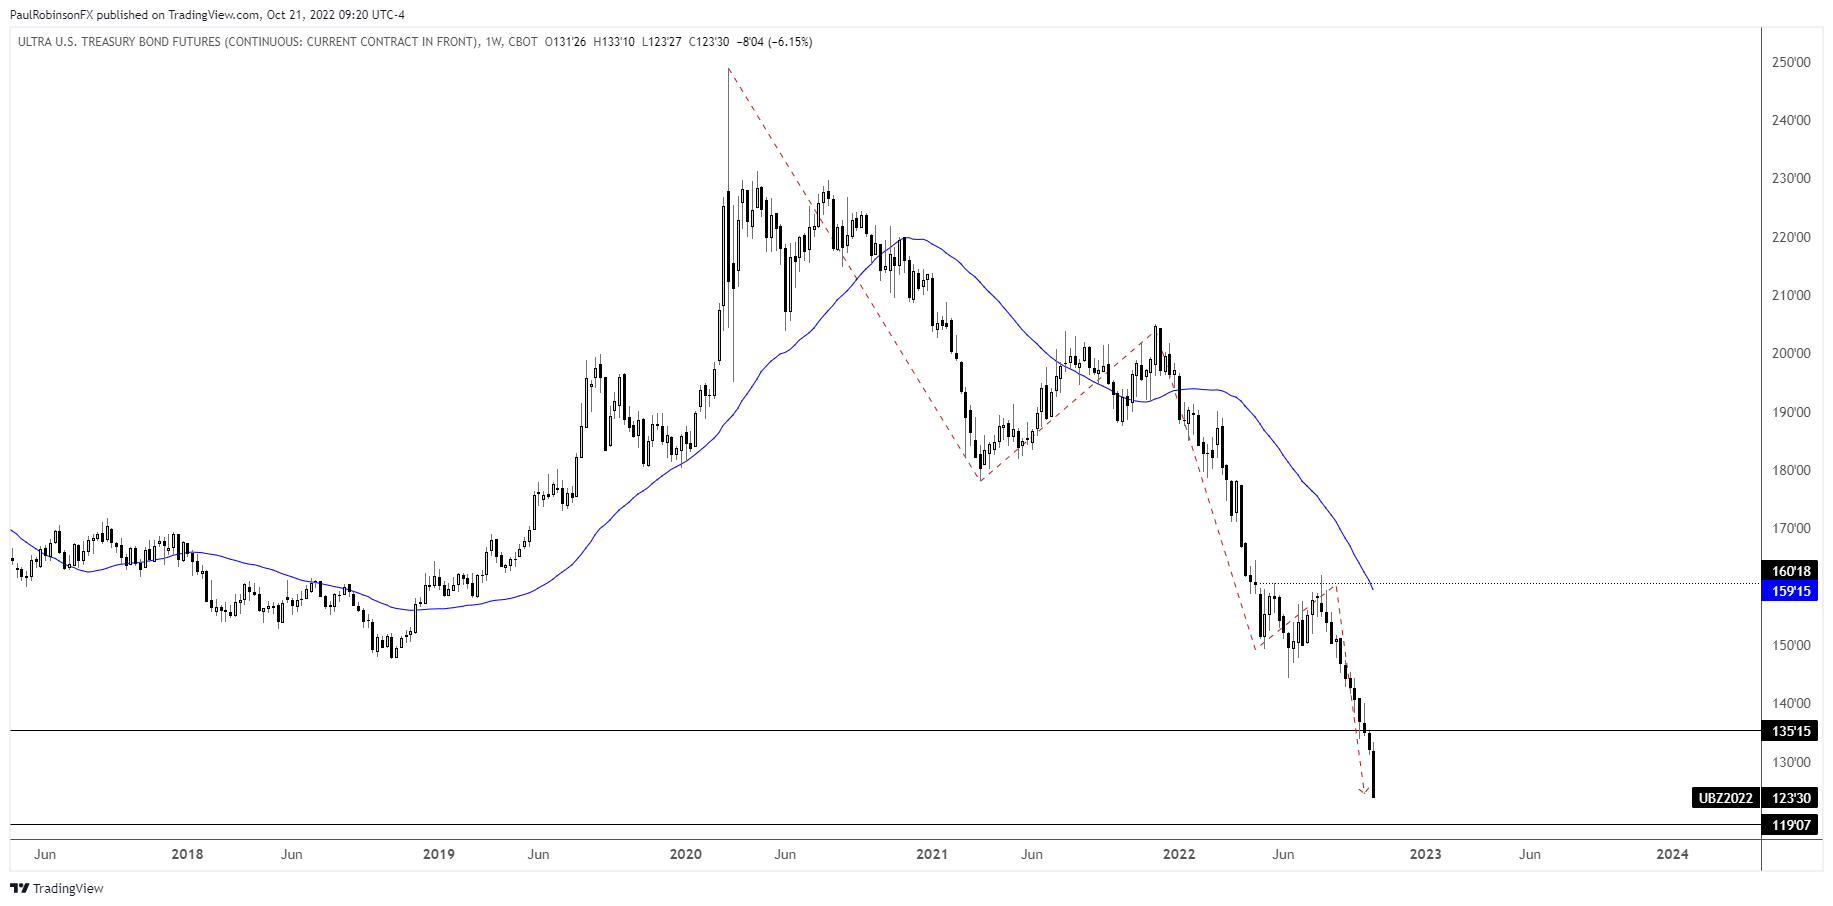
We have seen the dollar’s rise turn into a consolidation (it may break out, but for reasons to be discussed it may soon fail), stocks have rebounded and show some signs of stabilizing, but the bond market continues to fall. Hard. The selling has been orderly for the most part, but with the decline really deepening there are signs that the market is capitulating.
So far this week the selling has been the heaviest one week stretch since this leg lower began in early August, and is on pace for the worst week since Covid hit. To me this shows that the market is finally giving up and this is a good thing for creating a low.
I’m not an ‘Elliot wave guy’, but when a clear trend sequence develops I take note. Since the sell-off began after the capitulation top surrounding Covid, by my count we have seen three impulse waves and two corrective. If this is the case then the capitulation episode we are seeing is consistent with the end of the third impulse and should bring a meaningful low soon that will stick for awhile.
I don’t think it will be the low in bonds, but a tradeable one that leads to a corrective rally. A low in bonds would bring some rate relief and signal that the dollar will decline and stocks will recover for a bit. Perhaps into the new year.
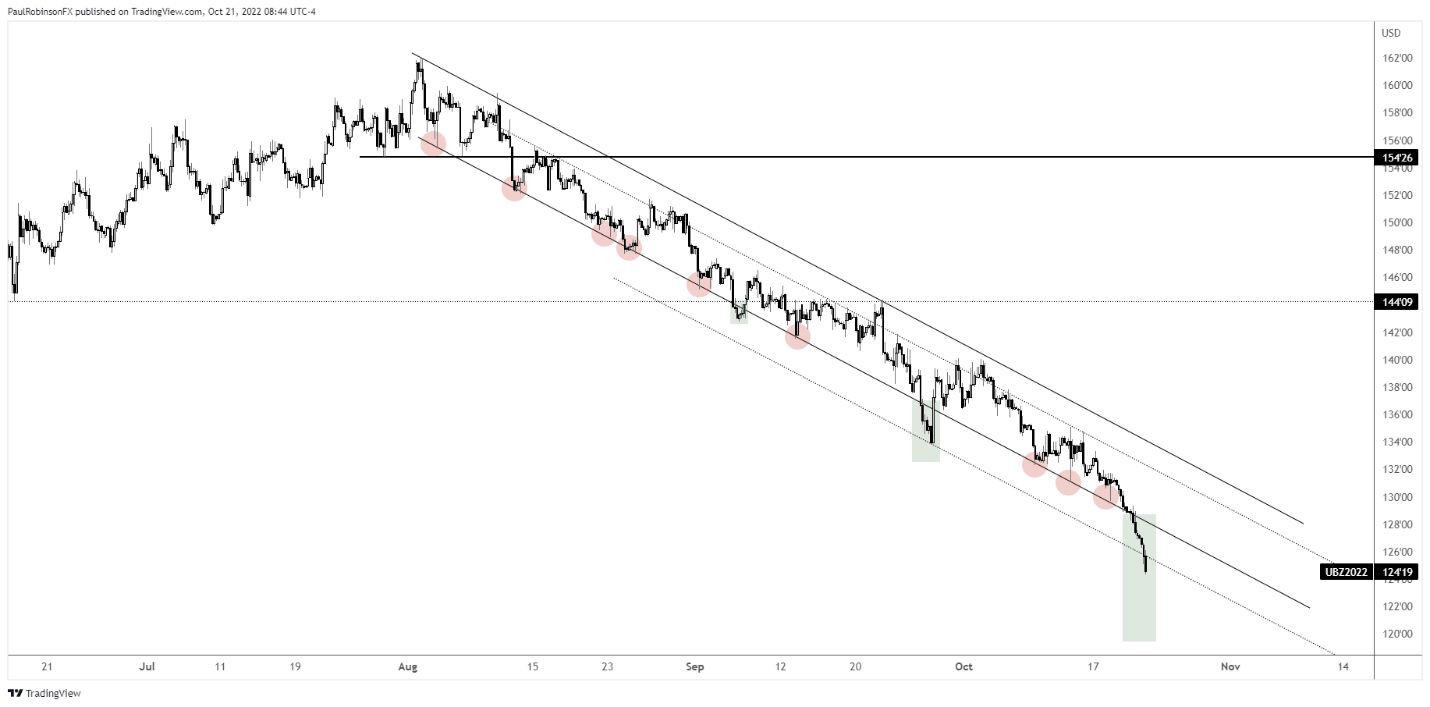
The 4-hr chart of the 30-yr ultra has a very clean trend structure to it with the lower side of the channel having been broken as of yesterday. This is where orderly is becoming disorderly. We saw a sharp turn a month ago not long after the underside slope was broken. This time we may see more of an extension first before a low if this is going to be a more significant low.
Tactically, buying bonds here is a bit like catching falling knives, but not the worst idea. However, it may be prudent to take a wait-and-see approach. If we are to see an intermediate-term low form then there will be time later to establish a wager on lower yields. A sudden and sharp turn higher will be the first signpost, then recapturing that channel and breaking out of the other side will add confirmation that a broader rally is underway.

30-yr Ultra Bonds (UB1!) Weekly Chart
30-yr Ultra Bonds (UB1!) 4-hr Chart
Resources for Forex Traders
Whether you are a new or experienced trader, we have several resources available to help you; indicator for tracking trader sentiment, quarterly trading forecasts, analytical and educational webinars held daily, trading guides to help you improve trading performance, and one specifically for those who are new to forex.
---Written by Paul Robinson, Market Analyst
You can follow Paul on Twitter at @PaulRobinsonFX


