


Australian Dollar, AUD/USD, AUD/NZD, AUD/JPY, Momentum -Talking Points
- The Australian Dollar remains in the range against USD, JPY and NZD for now
- Although there are some similarities, each currency pair has unique properties
- Momentum, retracements and triangles could provide some markers

The Australian Dollar is caught in ranges against several currencies, and this might reflect the broader macro picture where many central banks are set to be pausing on rate moves.
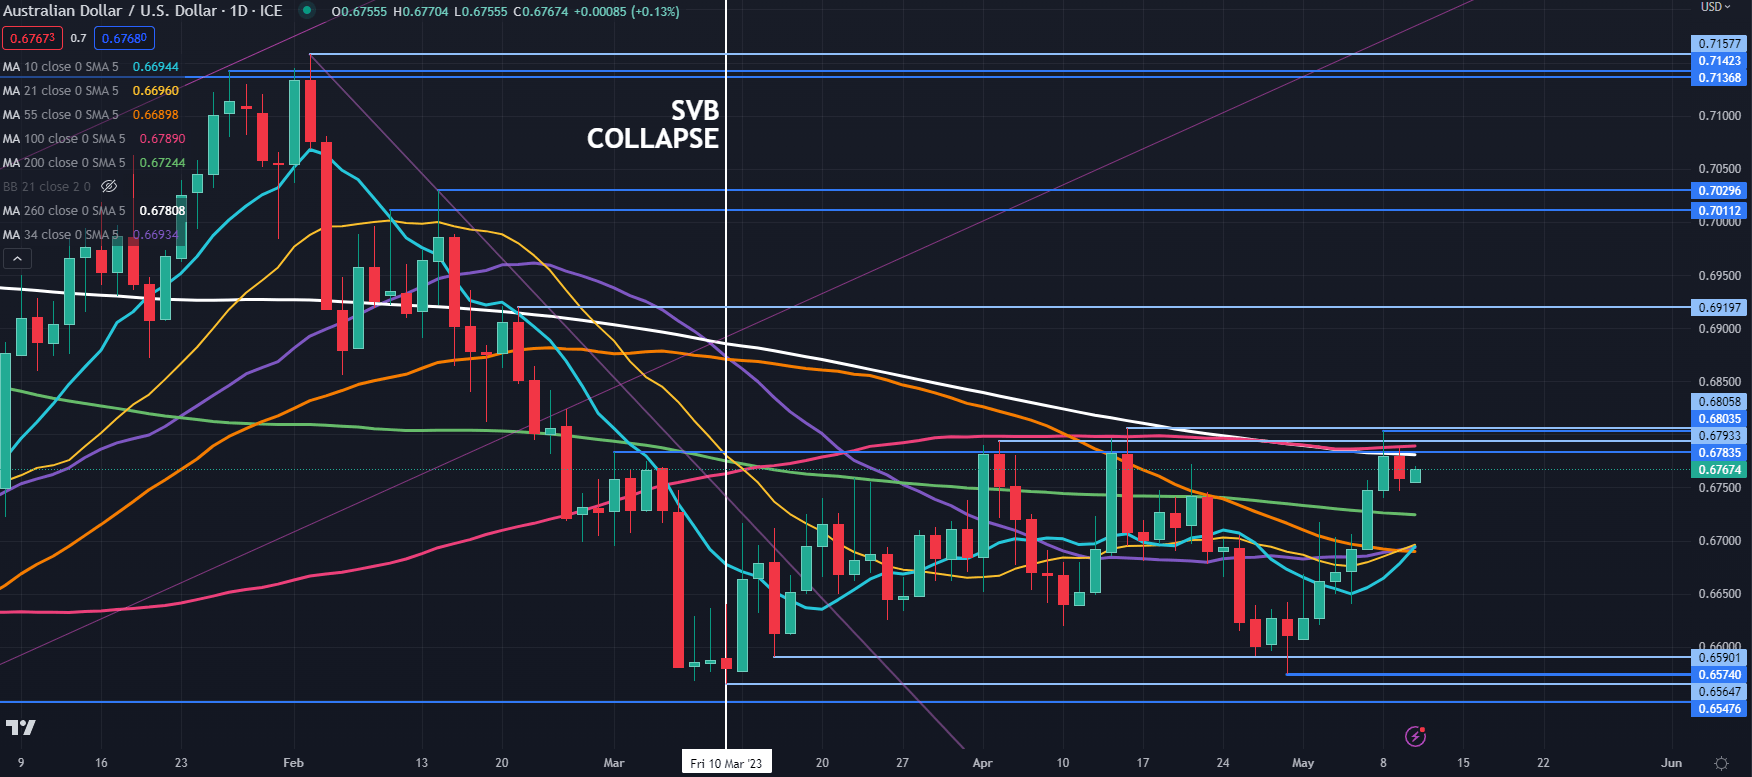
AUD/USD
AUD/USD has been in the 0.6565 – 0.6806 range for 11 weeks but it is currently bumping up the top end of it, making a high of 0.6804 on Monday.
There are several prior peaks 0.6784 – 0.6808 area and this may continue to offer a resistance zone. A break above there would also overcome the 100- and 260-day Simple Moving Averages (SMA) and should this occur, it might indicate evolving bullish moment
The price action of late has also enabled the shorter-term 10-, 21-, 34- and 55-day SMAs to converge just below 67 cents. A move under 0.6680 might see a run toward the bottom end of the range.
Previous lows in the 0.6550 – 0.6590 area might be the next support zone.
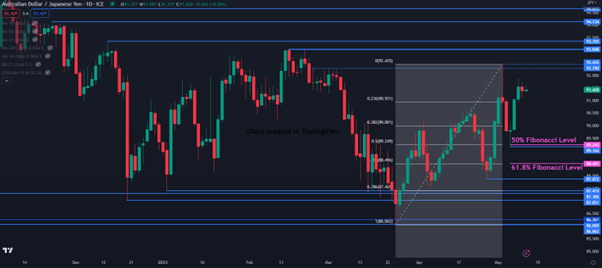
AUD/JPY
AUD/JPY has been in the 86.06 – 93.05 range for 5 months.
It pulled back from the recent high of 92.44 to just below the 50% Fibonacci Retracement level of the move from the low of 86.06 near 89.25. The 89.15 – 89.25 area may provide support.
Further down, the 61.8% Fibonacci Retracement level near 88.50 might lend support ahead of the prior lows and breakpoints of 87.87, 87.42, 87.30, 86.26, 86.07 and 86.06.
On the topside, resistance could be offered at the prior peaks of 92.29, 92.44, 93.05 and 93.36.

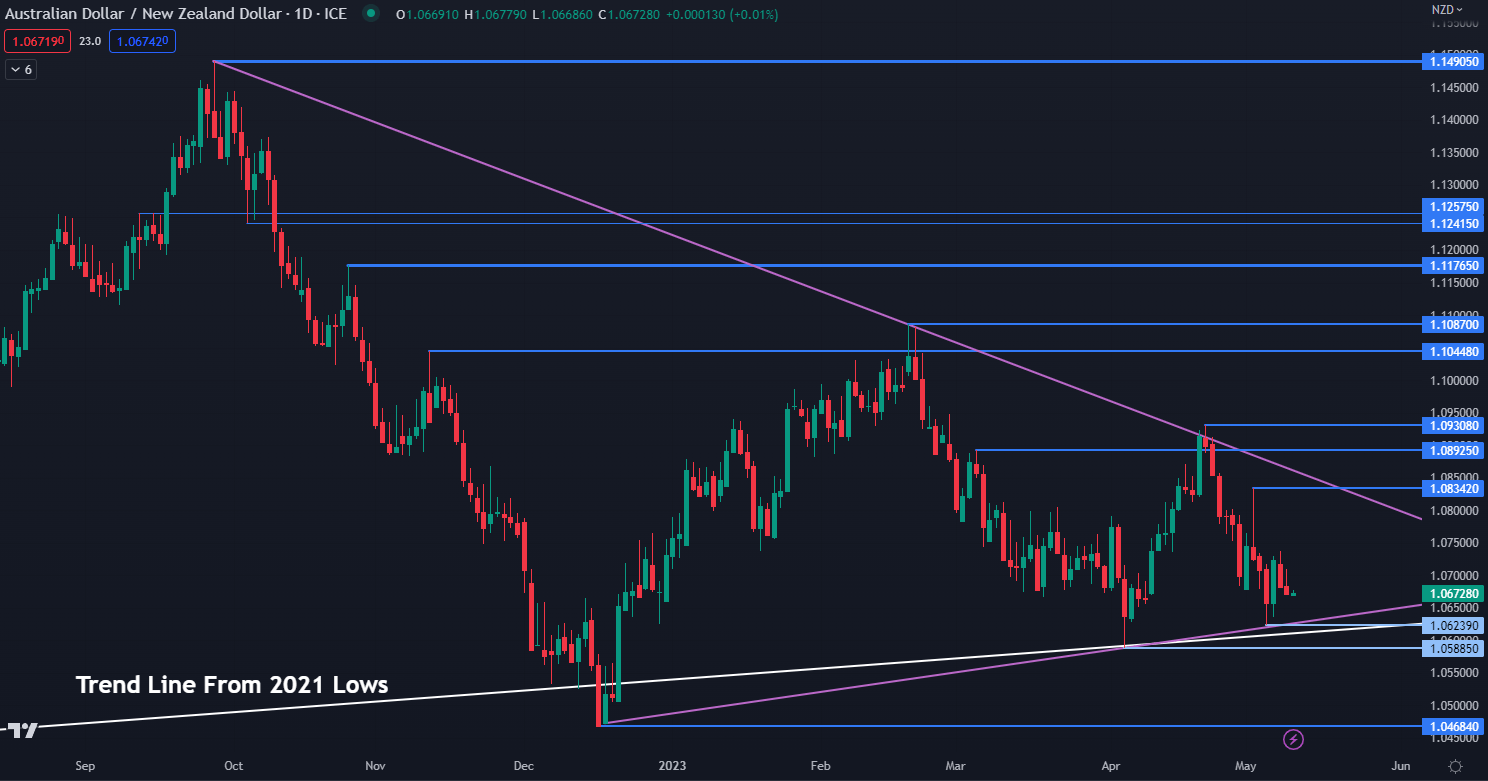
AUD/NZD
AUD/NZD has been narrowing in ranges for some time and this price action has seen a Symmetrical Triangle emerge.
Although the price tried to move above the upper trendline last month, it did not close above it and it proved to be a false break to keep the triangle formation intact. A conclusive break above or below the triangle might see momentum build in that direction.
Support may lie at the existing trend lines or the previous lows of 1.0624, 1.0588 and 1.0468. On the topside, resistance could be offered at prior peaks and breakpoints of 1.0834, 1.0893, 1.0931, 1.1045 and 1.1087.

--- Written by Daniel McCarthy, Strategist for DailyFX.com
Please contact Daniel via @DanMcCarthyFX on Twitter


