


Australian Dollar, AUD/USD, AUD/JPY, GBP/AUD, AUD/NZD – Price Action Setups:
- The Australian Dollar remains in a broadly bullish posture
- AUD/USD Rising Wedge and AUD/JPY trendline breakout eyed
- GBP/AUD breaking lower? Will AUD/NZD uptrend resume?

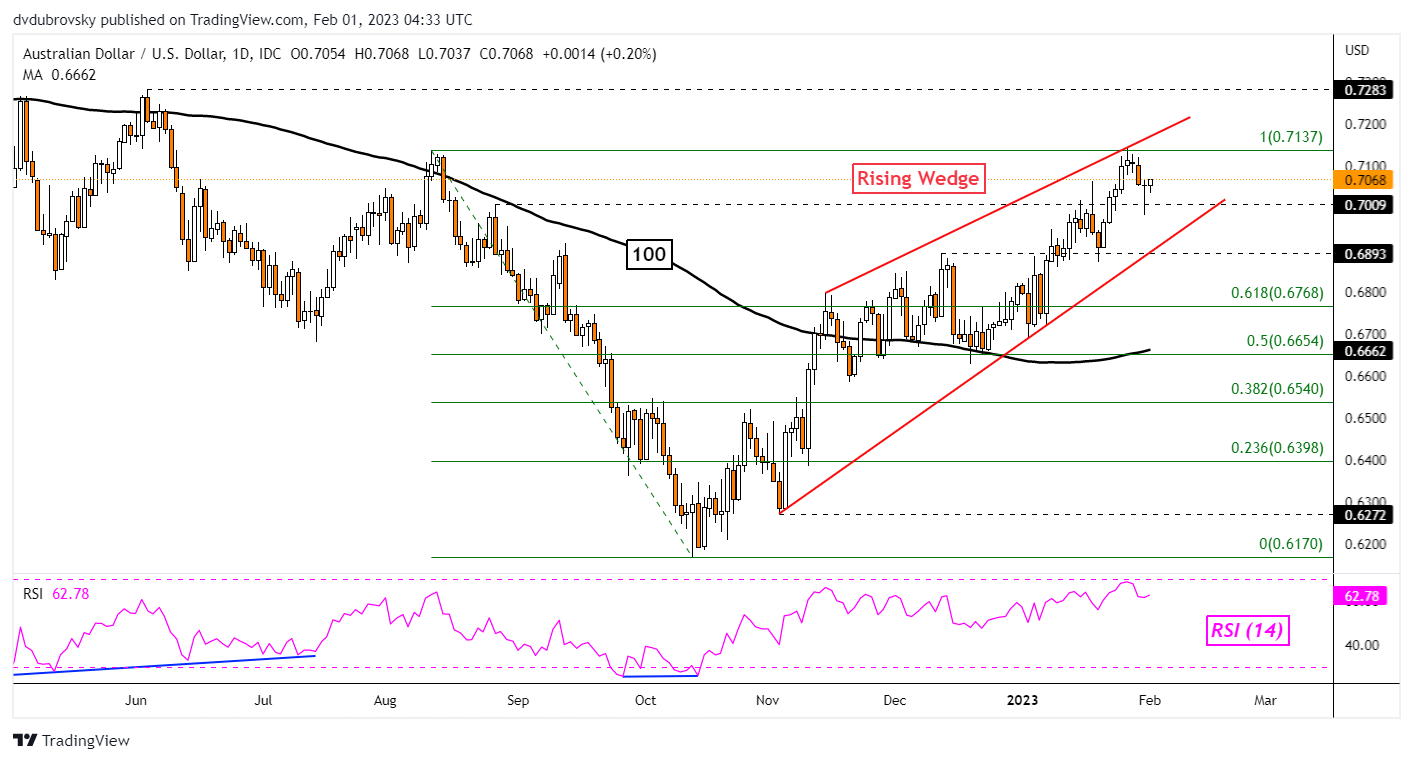
AUD/USD Daily Chart – Rising Wedge Eyed
The Australian Dollar remains pointed higher against the US Dollar with prices continuing to trade within a bearish Rising Wedge. Over the past 24 hours, AUD/USD was unable to hold a drop through the 0.7009 inflection point, leaving behind a fairly long lower wick. This is placing the focus on the August 2022 high at 0.7137. A breakout above this price could open the door to uptrend resumption. Otherwise, another attempt to clear 0.7009 places the focus on the rising floor of the wedge.
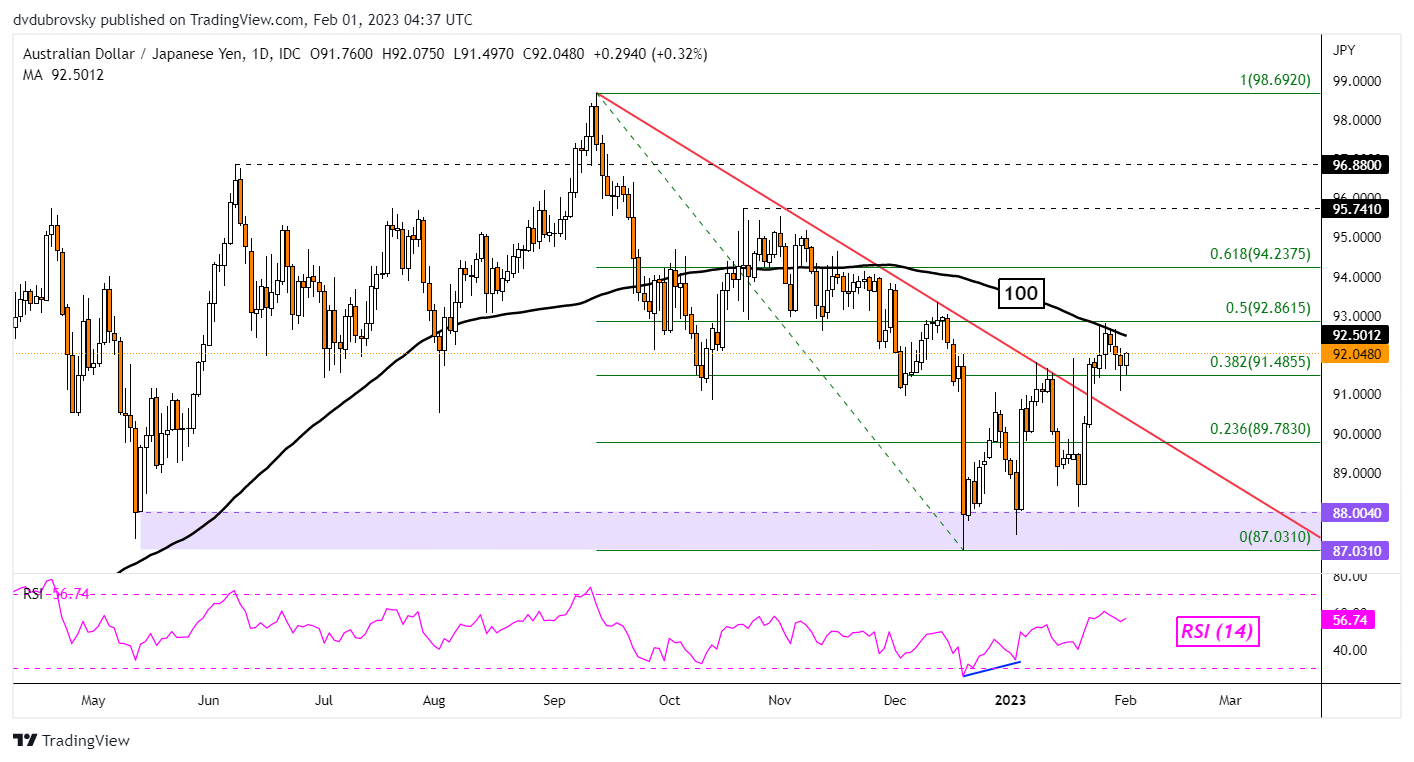
AUD/JPY Daily Chart – 100-Day SMA in Focus
The Australian Dollar has been struggling to hold a bullish breakout against the Japanese Yen. Earlier in January, AUD/JPY confirmed a push above the falling trendline from September. That opened the door to reversing the downtrend seen towards the latter half of 2022. Now, the 100-day Simple Moving Average (SMA) is holding as resistance, maintaining the downside focus. Clearing support, which is the 38.2% Fibonacci retracement level at 91.485, exposes lows from December. Otherwise, climbing above the SMA exposes the October high at 95.741.
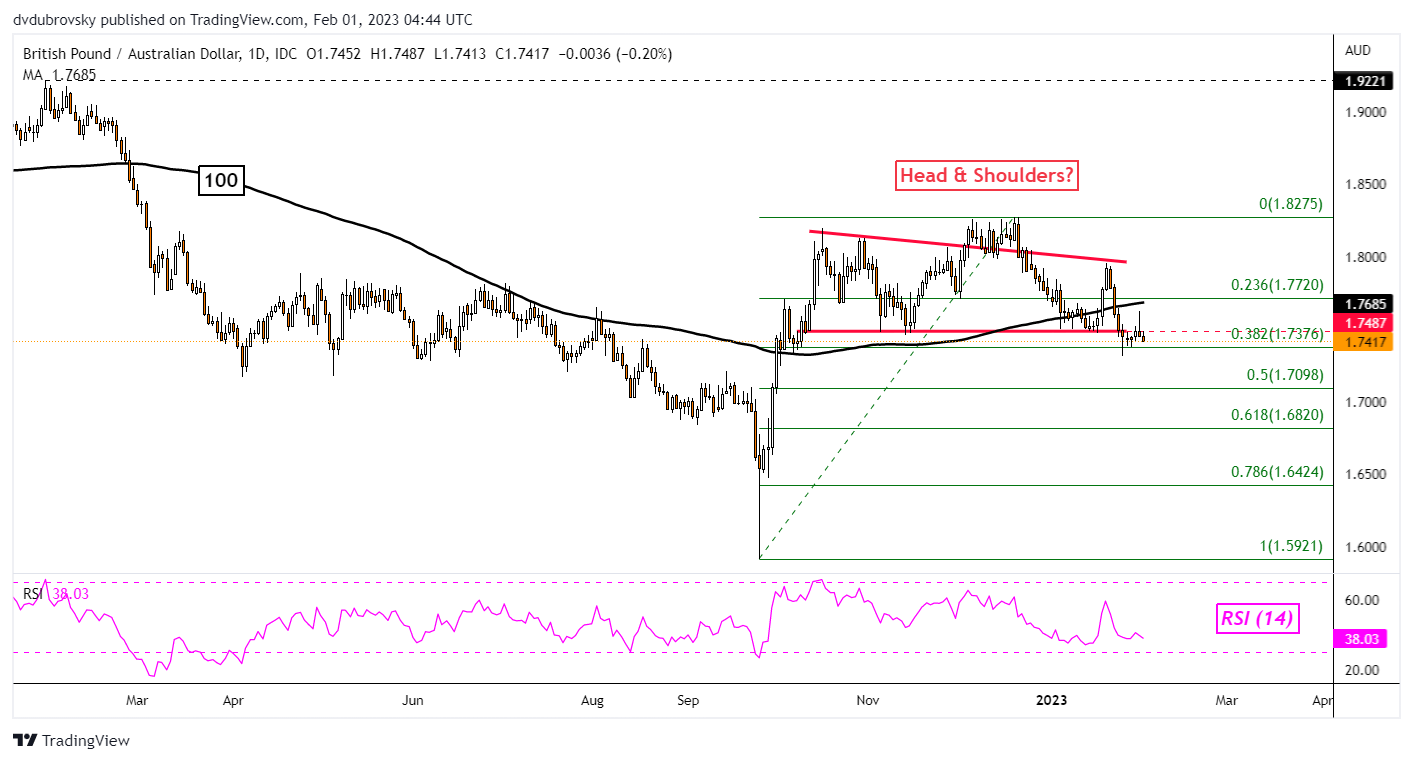
GBP/AUD Daily Chart – Head & Shoulders?
The Australian Dollar appears to be setting the stage for gains against the British Pound. GBP/AUD seems to have been carving out a bearish Head & Shoulders chart formation since September. Prices are attempting to clear the neckline around 1.7487. Confirming a breakout lower could open the door to extending losses toward the 61.8% Fibonacci retracement level at 1.682. Otherwise, the right shoulder of the chart pattern could play out as key resistance around 1.8.

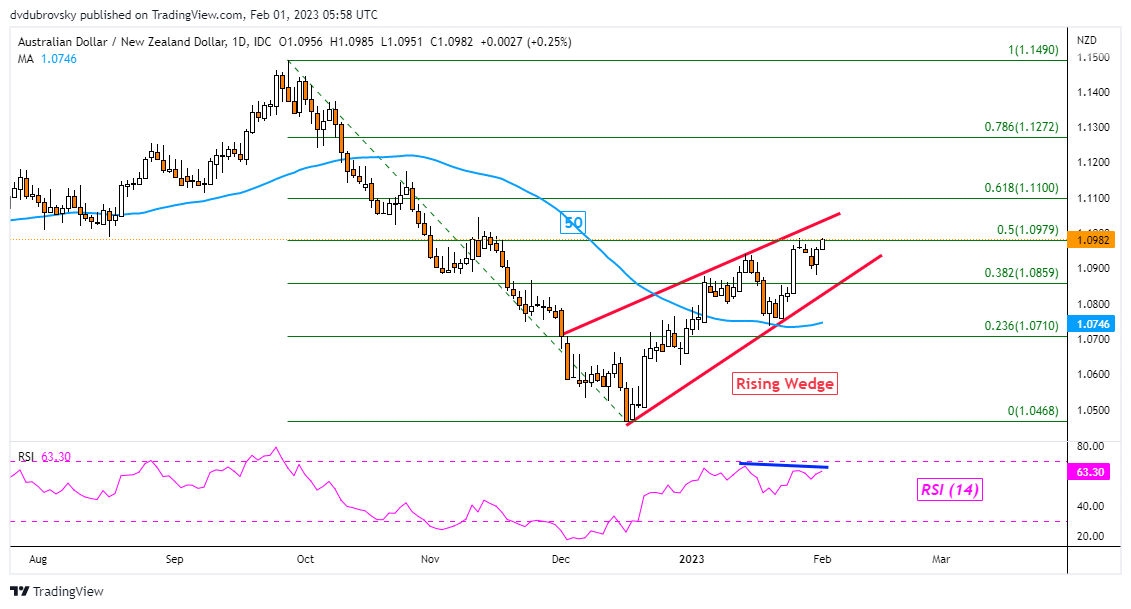
AUD/NZD Daily Chart – Eyes on Rising Edge
The Australian Dollar may continue trading higher against the New Zealand Dollar. That is because AUD/NZD is trading within the boundaries of a Rising Wedge chart pattern. While the formation itself can carry bearish implications, that comes into play if prices confirm a breakout under the wedge. Such an outcome opens the door to resuming the dominant downtrend from the end of last year. Clearing immediate resistance at 1.0979 exposes the 61.8% Fibonacci retracement level at 1.11.
--- Written by Daniel Dubrovsky, Strategist for DailyFX.com
To contact Daniel, use the comments section below or@ddubrovskyFXon Twitter


