


ASX 200, Nikkei 225 - Technical Outlook:
- The ASX 200 index has pulled back sharply from August.
- The Nikkei 225 is facing a bearish reversal pattern on the daily chart
- How much more downside is there for these indices?

ASX 200 Technical Forecast:
The sharp decline in Australia’s ASX 200 index this week so far could maintain a soft tone going into the weekend and coming 5 days. The Moving Average Convergence Divergence indicator (MACD), a measure of trend/momentum, is slightly below zero, implying a slight bearish tone. The zero line bifurcates bullishness versus bearishness, The further the MACD is from the zero line, the stronger the trend. The closer the MACD is to zero, the weaker the trend, and at times implying a lack of direction.
However, it would be too soon to conclude that the ASX 200 index is resuming this year’s downtrend. That’s because the June-August rebound has been substantial, marking a 61.8% retracement of the slide from April. In general, retracements of 62% tend to signify a reversal of the previous trend (downtrend in this case). It could well be possible that the index is in the process of forming a base for this year.
In this regard, a break above the August high of 7,138, coinciding with the 200-day moving average, would increase the likelihood that the worst is over. On the other hand, a fall below the early-September low of 6,720 would raise the odds that a broader range was developing. Subsequent support is at the mid-July low of 6,537.

ASX 200 Daily chart
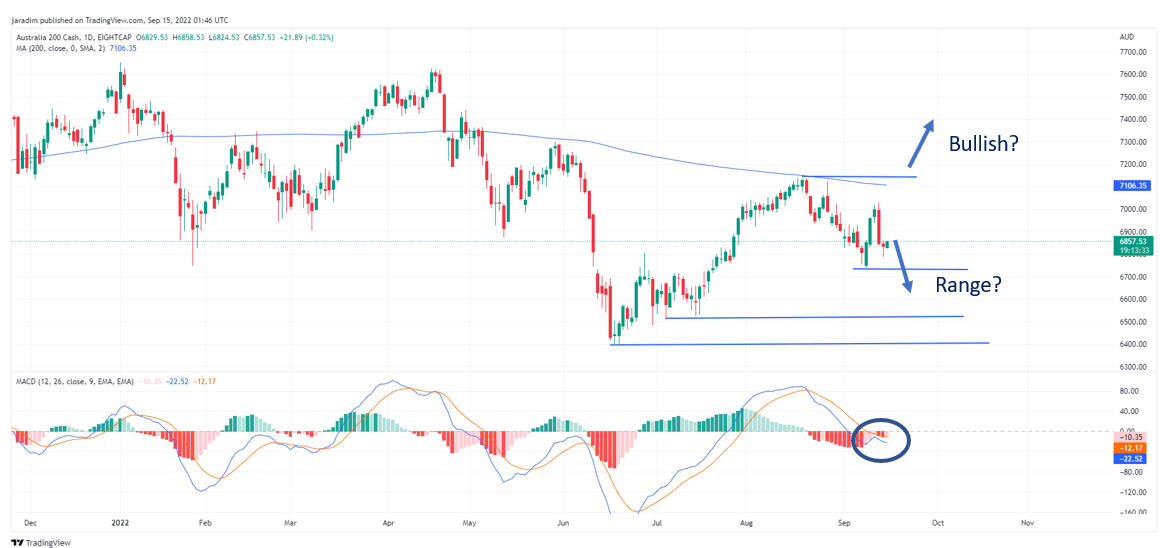
Chart Created Using TradingView
Nikkei 225 Index Technical Forecast:
Japan’s Nikkei 225 index risks some weakness in the near term following the retreat earlier this week from key resistance on a rising channel from early August and a bearish island pattern created on Wednesday. The latter is a pattern created where a group of bars is separated on either side by gaps, implying a reversal in the trend from up to down.
This week’s reversal follows a retreat in August from key resistance on a slightly upward-sloping channel from March 2022. Put together, the Japanese benchmark index is biased slightly lower, possibly towards the 200-day moving average (now at 27,430), roughly coinciding with the early-September low of 27,268.
A decisive break below could pave the way towards the lower edge of the channel from March (now at about 26,450). In contrast, a decisive break above the upper edge of the channel from March (now at about 29,440) would be quite bullish for Japanese equities, opening the way initially towards the November high of around 30,000.

Nikkei 225 Index Daily Chart
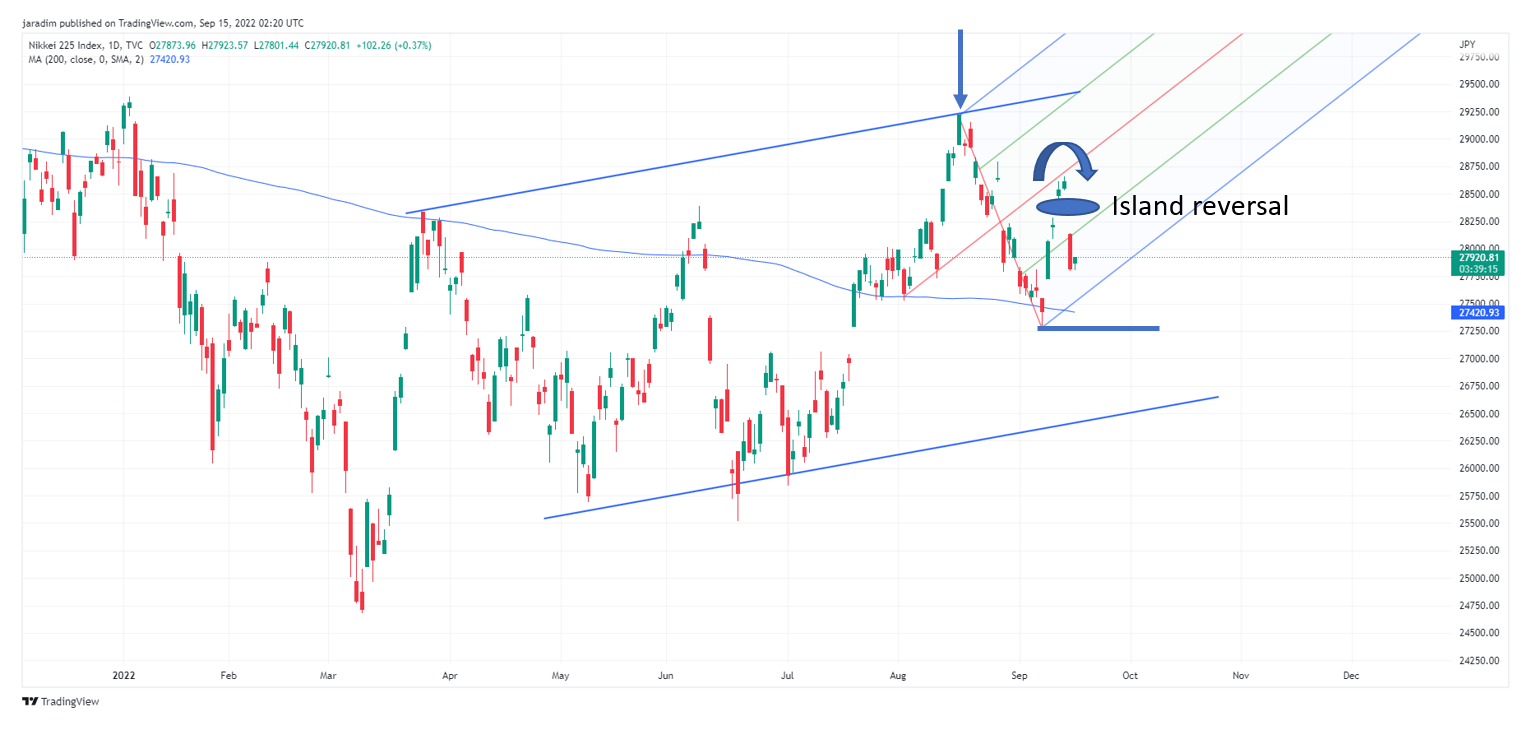
Chart Created Using TradingView
--- Written by Manish Jaradi, Strategist for DailyFX.com
To contact Manish, use the comments section below.


