


ASX, ASX 200 INDEX, KOSPI, KOSPI COMPOSITE INDEX - TECHNICAL OUTLOOK:
- ASX 200 index has scope to rise further.
- KOSPI index is yet to see any meaningful upward momentum.
- What are the key levels to watch?

ASX 200 SHORT-TERM TECHNICAL OUTLOOK – BULLISH
Australia ASX 200 index’s break above key resistance opens the door for further gains in the coming weeks/months.
The index’s break above the barrier at the August high of 7138 has triggered a double bottom (the June 2022 and the October 2022 lows), pointing to a potential rise toward 7865. This follows a hold last year above crucial support on the 200-week moving average, coinciding with a 38.2% retracement of the 2020-2021 rise (see chart).
ASX 200 INDEX Weekly Chart
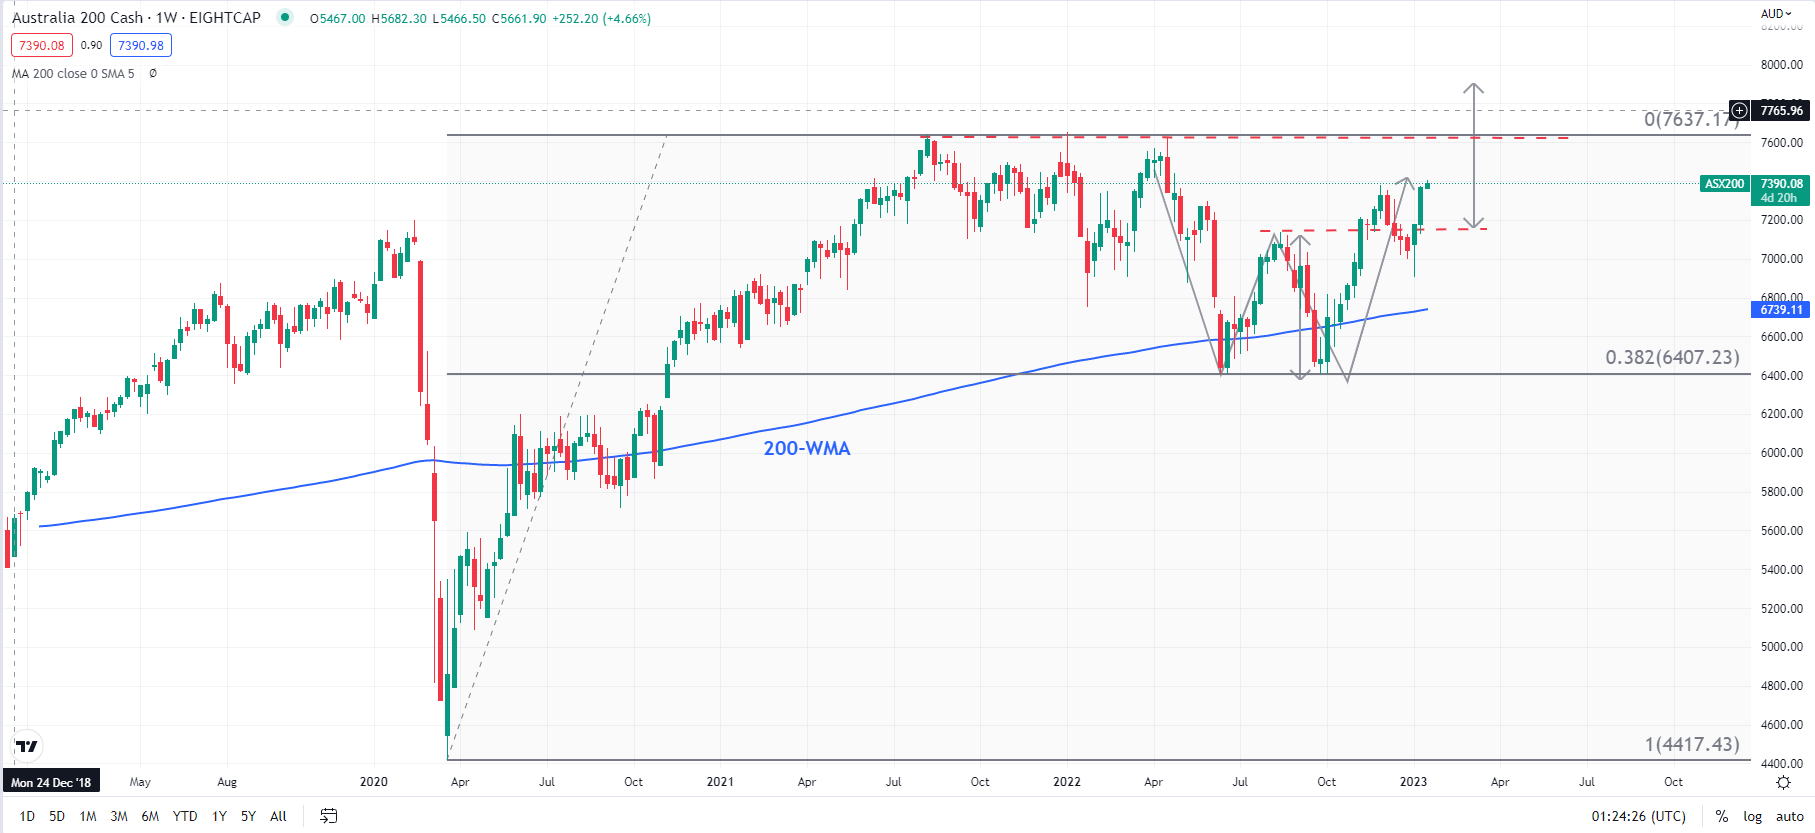
Chart Created Using TradingView
Fibonacci retracements of 38.2%-50% are considered reasonable and corrective, rather than a reversal of the trend. In the case of the ASX 200, the 2021-2022 decline was a correction of the post-Covid bull run and not the start of a bear market.
The price objective of the bullish double bottom pattern implies a break above the record high of 7633 hit in 2021 to new cycle highs. On the downside, there is quite strong support at the early-January low of 6905, near the 200-day moving average.

KOSPI SHORT-TERM TECHNICAL OUTLOOK - NEUTRAL
While the ASX 200 index’s uptrend is getting re-established, it would be too soon to conclude that the downward pressure has faded for the South Korean benchmark index, Kospi.
Even though the Kospi has seemingly moved out of a multi-month downtrend channel since 2021, the index hasn’t made any fresh new ground – on the upside or downside. For the downward pressure to fade, the index at minimum needs to break above immediate resistance on the 200-day moving average, near the end-2022 high of 2500.
KOSPI COMPOSITE INDEX Daily Chart
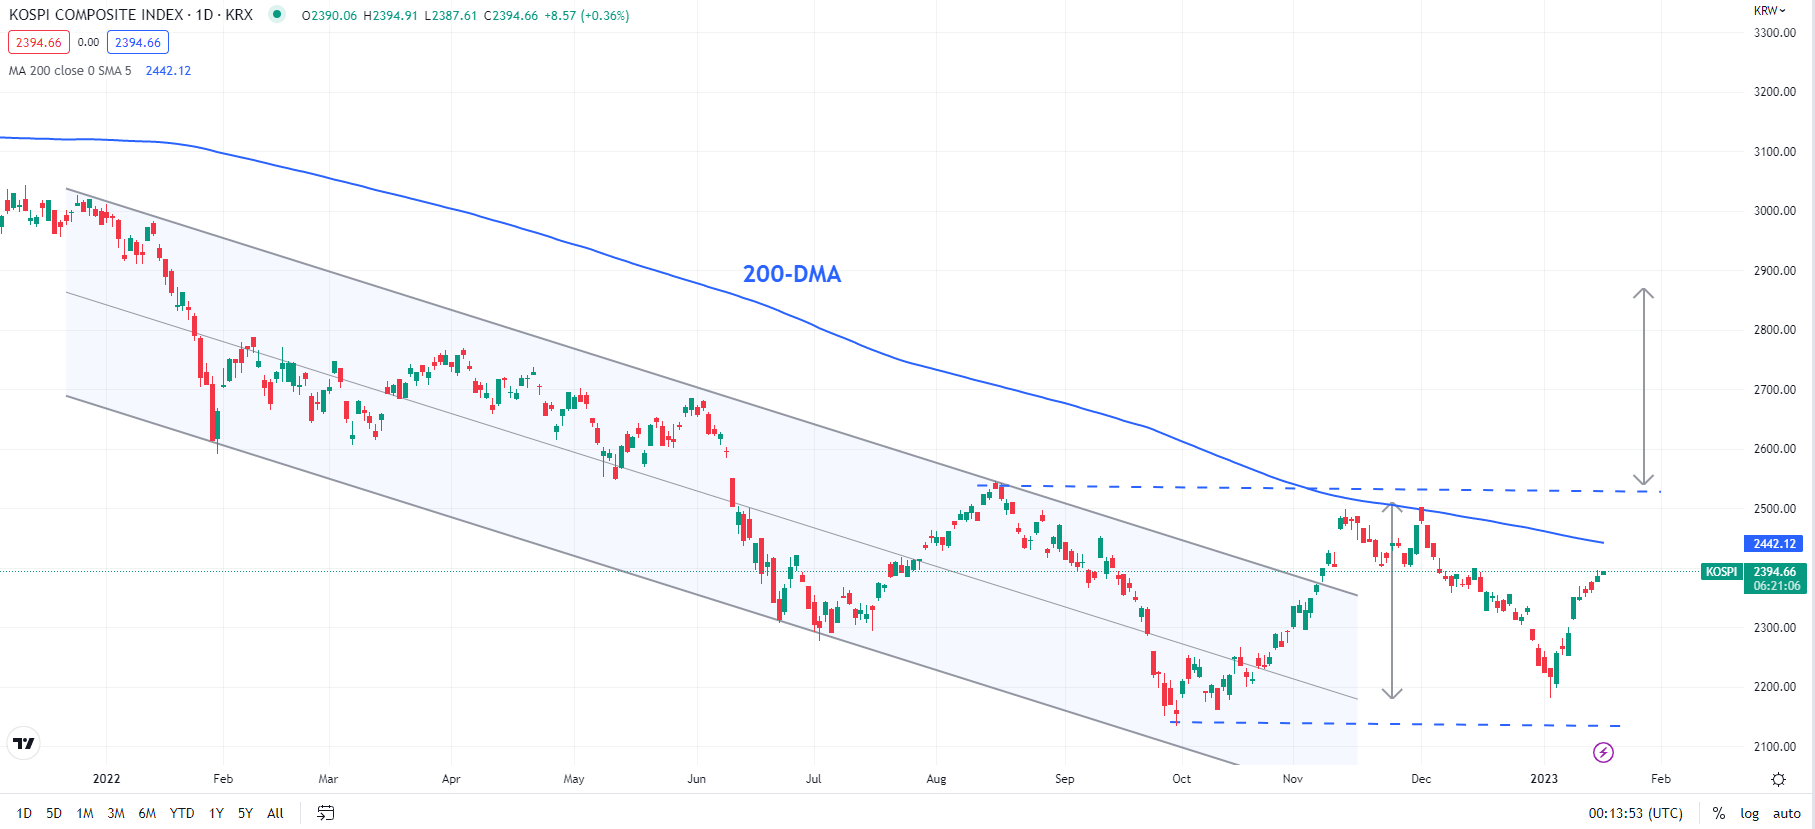
Chart Created Using TradingView
The moving average has served as a good hurdle since the downtrend began in 2021. Hence a decisive break above the moving average would be bullish. Any break above 2500 would trigger a double bottom (the 2022 and January 2023 lows), pointing to a potential rise toward 2820 in subsequent weeks/months. On the downside, Kospi needs to hold above the 2022 low of 2135 for the bearish pressure to begin easing.

--- Written by Manish Jaradi, Strategist for DailyFX.com


