


US Dollar Vs Euro, British Pound, Japanese Yen – Price Setups:
- It would be premature to call the US dollar’s recent rebound a reversal of the downward.
- Recent Fed speak has been hawkish, putting the spotlight on Powell’s speech coming Friday.
- What’s next for EUR/USD, GBP/USD, and USD/JPY?

The rebound in the US dollar over the past week or so appears to be a consolidation, and not a reversal of the well-established downtrend, at least yet.
The US dollar index’s (DXY index) rise above immediate resistance at the early-March high of 102.40 confirms that the immediate downward pressure has eased somewhat, thanks to hawkish remarks from US Federal Reserve officials. Richmond Fed President Thomas Barkin said he was “comfortable” with raising rates further if needed to lower inflation. Cleveland Fed chief Loretta Mester said the US central bank was not at a point yet where it can hold rates steady.
US Dollar Index (DXY) Daily Chart
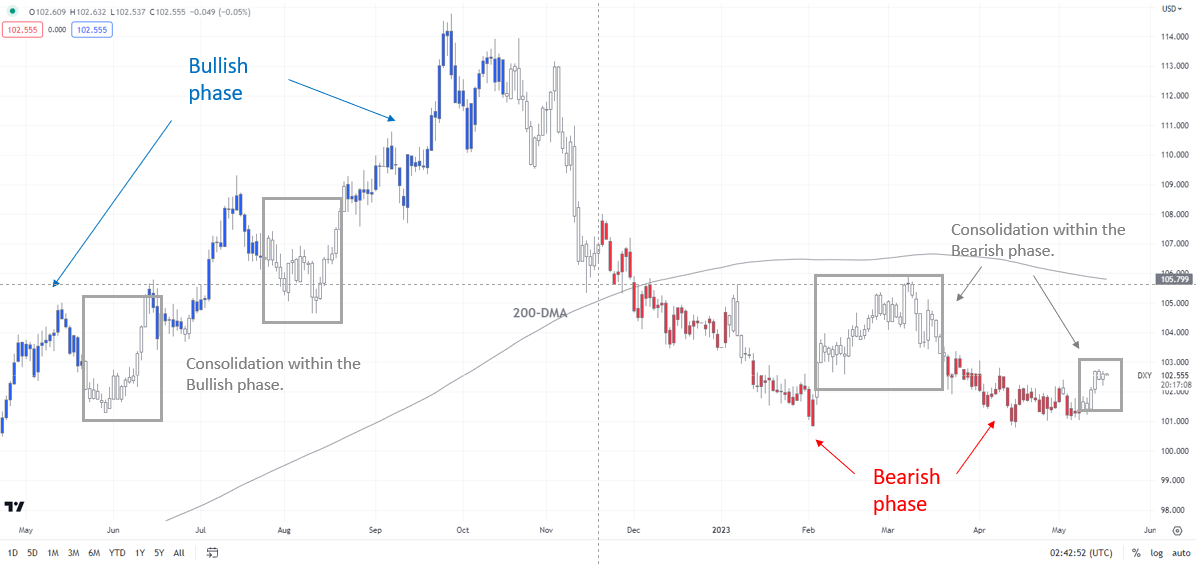
Chart Created by Manish Jaradi Using TradingView; Notes at the bottom of the page.
This follows remarks from New York Federal Reserve President John Williams last week that the Fed may not be done raising rates. Still, the DXY index's trend is broadly bearish and the recent rebound is a consolidation, as the daily colour-coded candlestick chart based on trending/momentum indicators shows.
Markets are currently pricing in an 18% chance of another 25 basis points of a rate hike at the June meeting. The odds of 75 basis points rate cuts by the year-end have scaled back to 35% from 42% a week ago, according to CME’s FedWatch tool.Key focus is now on US Fed Chair Powell’s speech on May 19 – a hawkish tilt could keep the USD well bid.
EUR/USD Weekly Chart
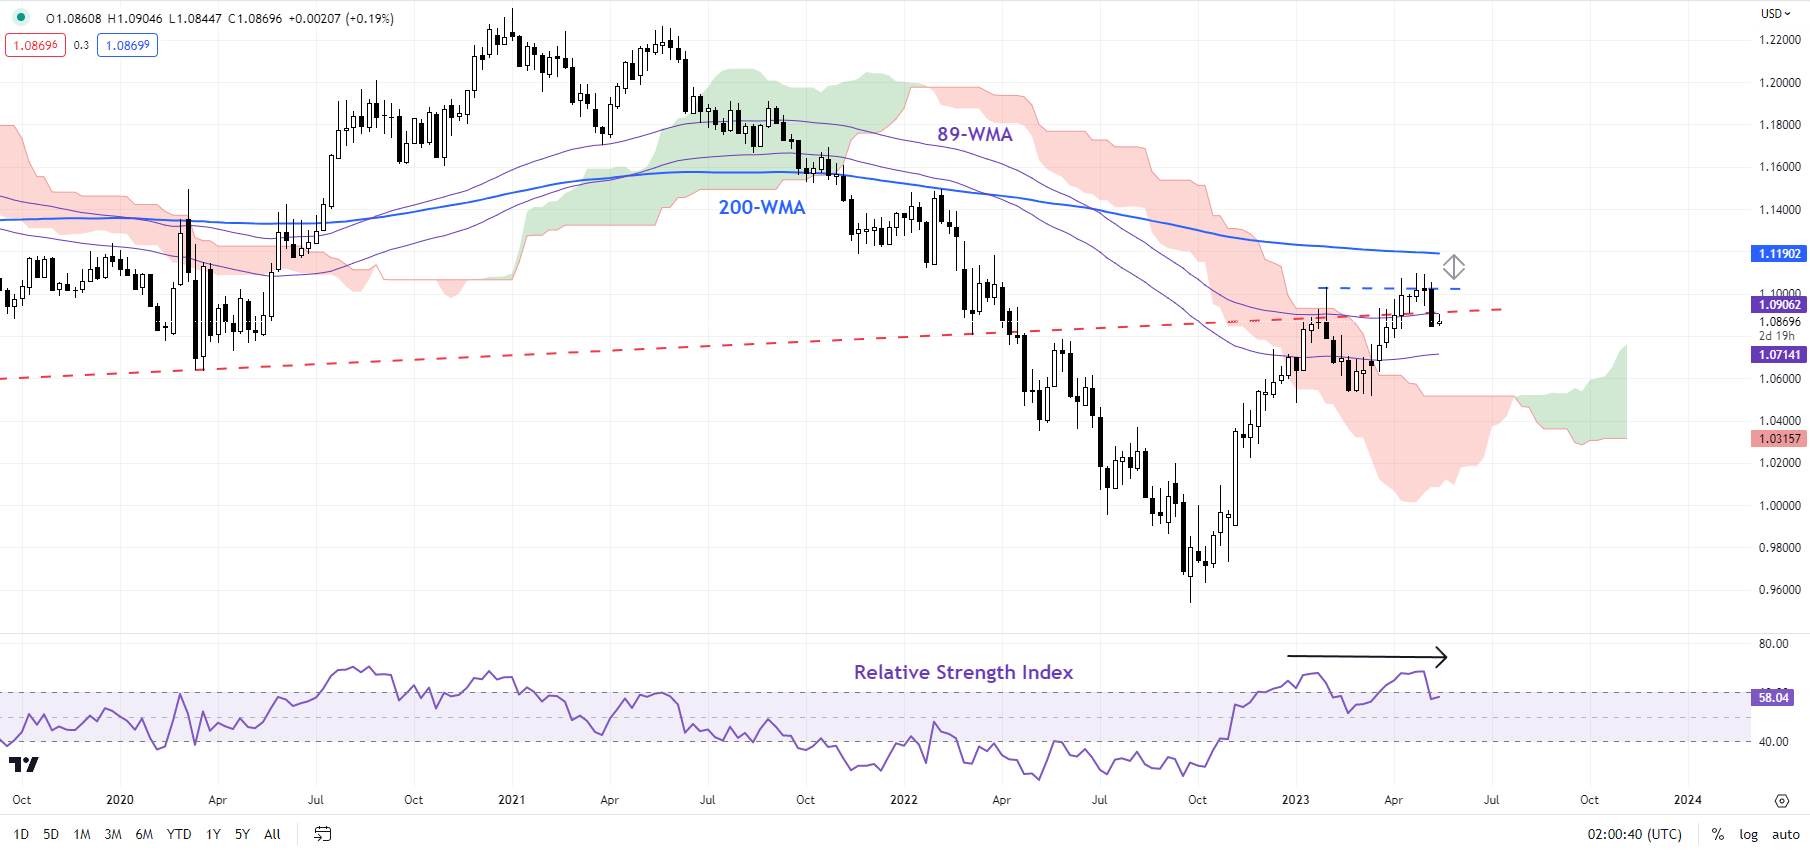
Chart Created by Manish Jaradi Using TradingView
Furthermore, the patchy post-Covid rebound in China and deepening producer price deflation have raised concerns regarding slowing demand in the world’s second-largest economy weighing on commodity-sensitive currencies like the Australian dollar and the New Zealand dollar.
EUR: Slight soft bias
EUR/USD’s break last week below minor support at the early-May low of 1.1000 indicates that the upward pressure is easing. See the previous update that highlighted the risk of a setback “Did ECB Just Put Brakes on Euro’s Rally? EUR/USD, EUR/AUD, EUR/JPY”, published May 5.
EUR/USD Daily Chart
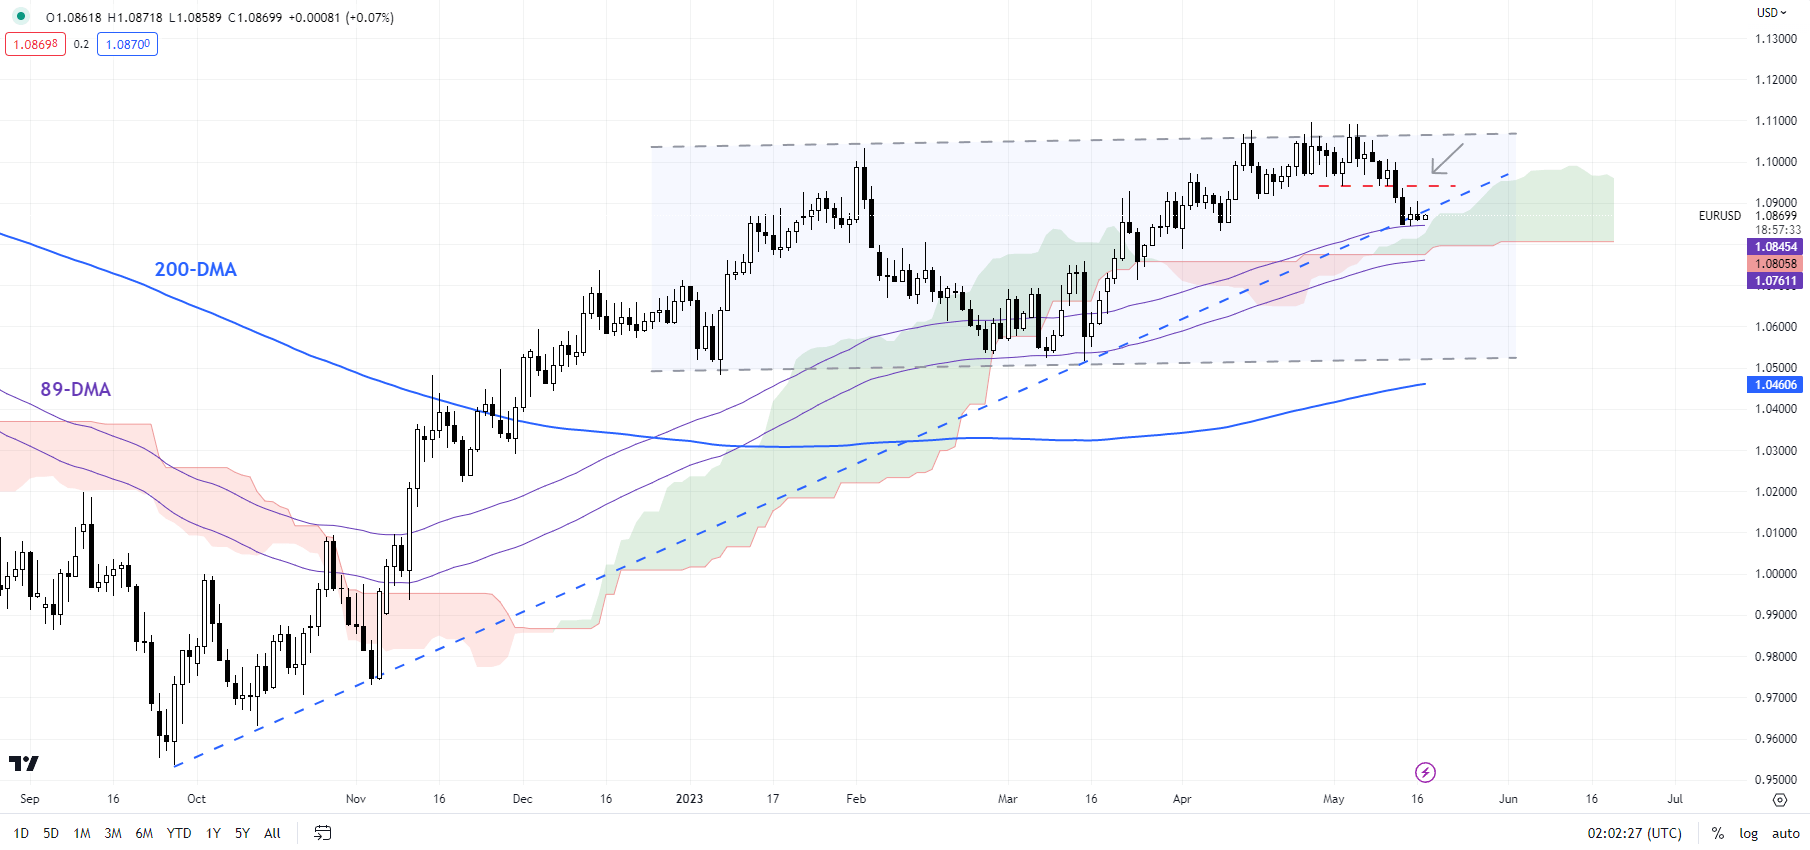
Chart Created by Manish Jaradi Using TradingView
The next support to watch would be the 89-day moving average, coinciding with the lower edge of the Ichimoku cloud on the daily chart (at about 1.0750). Any break below could pave the way for a deeper setback toward the March low of 1.0510. However, as of now, the probability of a significant fall looks low given the broader uptrend is in place. For more discussion on the trend, see “To What Extent Euro Could Fall: EUR/USD, EUR/GBP, EUR/JPY Price Setups”, published May 16.
GBP/USD Daily Chart
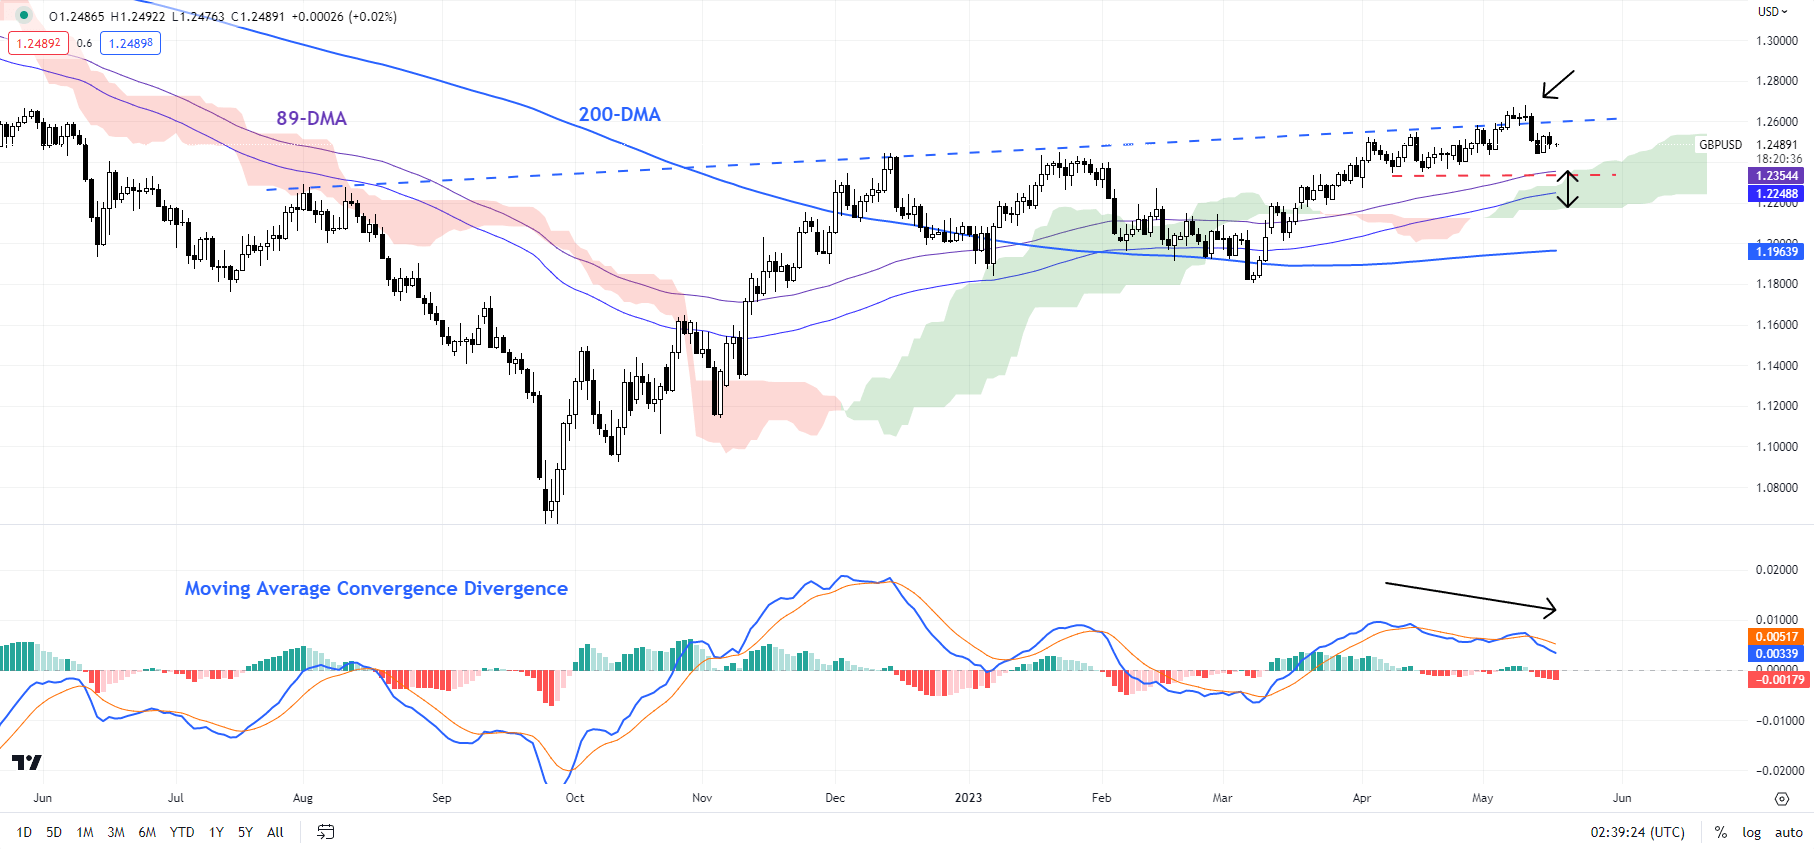
Chart Created by Manish Jaradi Using TradingView
GBP/USD: Rally stalls at resistance
While the broader trend remains bullish (see “British Pound Buoyant Ahead of BOE: How Much More Upside?”, published May 8), the recent retreat from a slightly upward-sloping trendline, associated with weakening upward momentum, is a reflection of slight fatigue in the rally. Still, GBP/USD has quite a bit of cushion around 1.2200-1.2350 which could limit any further downside.
USD/JPY 240-minute Chart
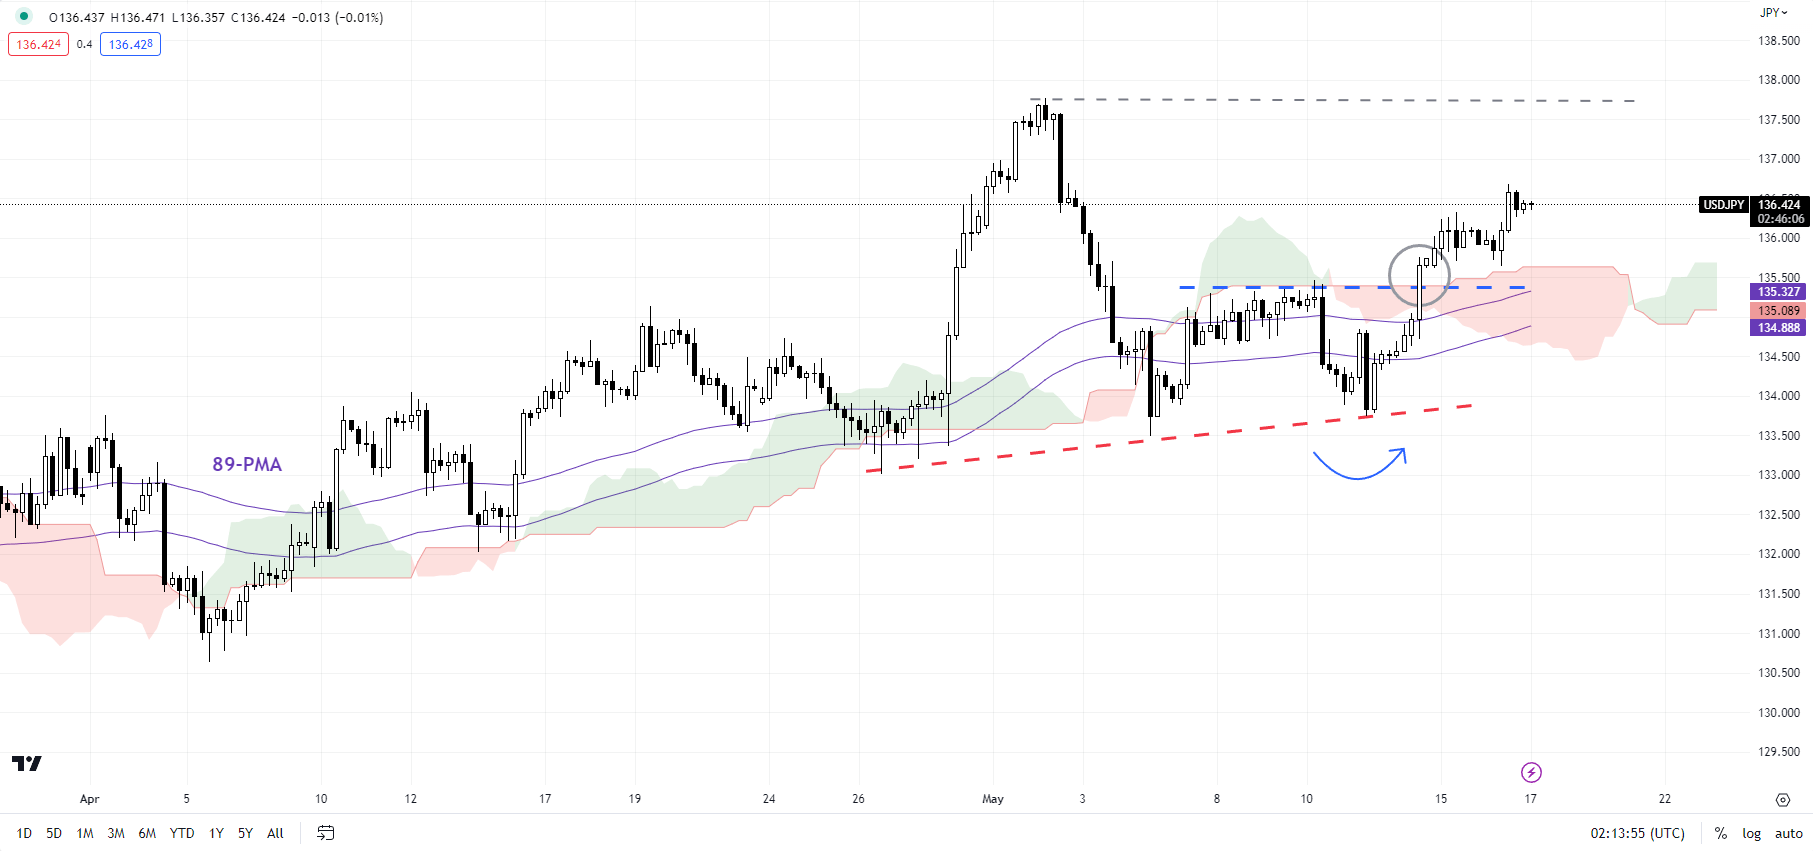
Chart Created by Manish Jaradi Using TradingView
USD/JPY: Broad range looks set to continue
USD/JPY’s rise above the initial ceiling at the May 10 high of 135.50 confirms that the immediate downward pressure has faded. This coupled with the rebound from a stiff cushion on an upward sloping trendline from the end of April confirms that the pair remains in a broad 133.00-138.00 range for now.
Note: In the above colour-coded chart, Blue candles represent a Bullish phase. Red candles represent a Bearish phase. Grey candles serve as Consolidation phases (within a Bullish or a Bearish phase), but sometimes they tend to form at the end of a trend. Note: Candle colors are not predictive – they merely state what the current trend is. Indeed, the candle color can change in the next bar. False patterns can occur around the 200-period moving average, or around a support/resistance and/or in sideways/choppy market. The author does not guarantee the accuracy of the information. Past performance is not indicative of future performance. Users of the information do so at their own risk.
Trade Smarter - Sign up for the DailyFX Newsletter
Receive timely and compelling market commentary from the DailyFX team
--- Written by Manish Jaradi, Strategist for DailyFX.com
--- Contact and follow Jaradi on Twitter: @JaradiManish


