


Access Free Oil Trading Guide from DailyFX Analysts HERE !
Talking Points:
- Crude Oil Technical Strategy: Support At Prior Triangle ($51-$49/bbl) Under Pressure
- Internal OPEC Dissent Worries Develop on Iraq Oil Minister Comments
- Gold Price and Oil See Headwinds as USD Strongest Since February
Crude Oil price has drifted lower at the start of the week after discouraging news for traders looking for confirmation that an OPEC deal is around the corner. Specifically, Iraq’s Oil Minister said that Iraq should be exempt from the OPEC accord to cut production due to their ongoing struggle with Islamic Militants.
Russia also refused over the weekend to confirm that they would join OPEC in the production cut as Alexander Novak, the Russian Energy Minister has said that they are looking at “many scenarios,” to see what will bring about an Oil Recovery. Last week, U.S. Aggregate supply showed its sixth decline in seven weeks and the size of the draw caused Oil to trade at 2016 highs.
Interested In a Quick Guide about OPEC, Click Here
These reports could cause a “wait-and-see” approach to a fixed-time agreement to cut production. Any failure of a production cut to materialize would be expected to take the price of Oil down by ~10-20% as much of the recent move to above $50 has been in expectation of the largest producers in the world bring supply in line with demand.
On cross-market effect that could help the price of Oil is if the USD were to pull back from it’s run into seven-month highs. Per the DXY, the US Dollar is sitting near the top of its regression band from August and is due for a pullback this week, which could support the price of Oil as the DXY & Oil have a historical inverse relationship.
H4 Crude Oil Price Chart: Watching Triangle Support On Price Pullback @ $49.70/19 per bbl

The WTI Crude Oil chart above shows two key levels that price could test if Oil weakness were to persist. The first zone that we’ve mentioned before is the support points of the consolidating triangle. The lower points of the triangle are $49.35/bbl followed by the base on the Bullish Key Day at $49.17/bbl.
If these levels continue to hold, we’ll keep a Bullish Bias, and look for impending USD weakness to help get us there until we get more information about the OPEC deal. Should OPEC deals continue to disintegrate, and Oil weakness persists below the support on watch, we’d look for the price to move toward trendline support that is currently between the 50%-61.8% Fibonacci Retracement zones at $47.23-$46.24/bbl. of the September-October Range from $42.72-$51.92/bbl.
Oil Implied Volatility has continued to be low since August, which continues to keep our bias higher
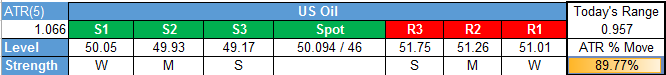
Key Levels Over the Next 48-hrs of Trading As of Friday, October 24, 2016
T.Y.
To receive Tyler’s analysis directly via email, please SIGN UP HERE


