


Talking Points:
- CAC 40 Trends Lower in the Short Term
- Intraday Support is Found Near 4,834.96
- Looking for additional trade ideas for equities markets? Read our 2017 Market Forecast
CAC 40 is trending lower, and is set to close down for its 4th consecutive trading session. So far for Tuesday, the Index is trading down -.10%. European markets as a whole are mixed, with German Unemployment data in focus for tomorrows trading. Top winners for the CAC 40 include Carrefour (+1.89%) and Vivendi (+1.30%). Losers for the day include Schneider Electric (-0.48%) and Pernod Ricard (-0.51%).
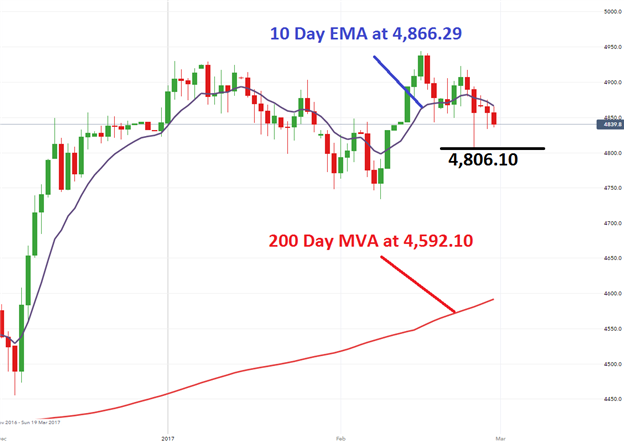
Technically, the CAC 40 is trending lower in the short term. The Index is currently below its 10 Day EMA (exponential moving average) which is found at 4,866.29. If prices continue to trend lower, the next major point of support may be found at last Friday’s low at 4,806.10. A move below this point would suggest a larger bearish retracement may be in play, against the pairs long term uptrend. It should be noted here that the CAC 40 remains above its 200 day MVA (simple moving average), which is found at 4,592.01.
CAC 40, Daily Chart with Averages
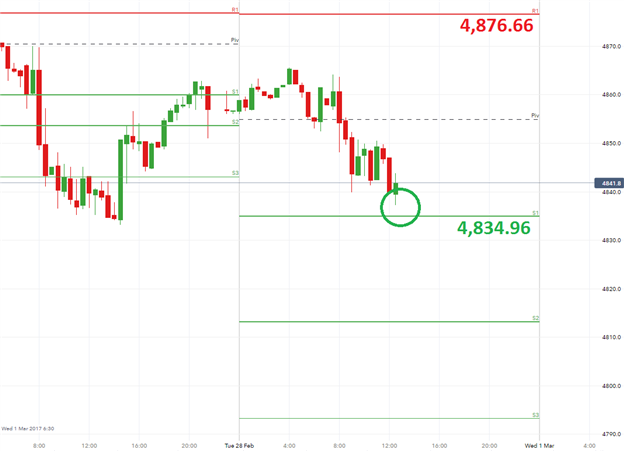
Intraday the CAC 40 is trading beneath its central pivot, found at 4,854.93. Typically this is interpreted as bearish, and now the Index is challenging intraday support found at the S1 pivot at 4,834.96. If prices continue to decline here, it opens the CAC 40 to test other values of support. This includes the S2 and S3 pivots found at 4,813.23 and 4,893.26 respectively.
It should be noted that if prices rebound, the CAC 40 will need to first breakout above the previously mentioned central pivot. At which point, other intraday values of resistance include the R1 and R2 pivot found at 4,876.66 and 4,896.63.
CAC 40, 30 Minute Chart with Pivots
--- Written by Walker, Analyst for DailyFX.com
To Receive Walkers’ analysis directly via email, please SIGN UP HERE
See Walker’s most recent articles at his Bio Page.
Contact and Follow Walker on Twitter @WEnglandFX.


