

USD/ILS

USD/ILS
| Low | |
| High |
Note: Low and High figures are for the trading day.
This pair represents the US Dollar - Israeli Shekel cross. In this pair, the value of one US Dollar is quoted in terms of the Israeli Shekel. Israel represents a socialist country for most intensive purposes, and economic conditions are heavily influenced by the Bank of Israel and the Knessett or legislative branch of Israel. Consequently, a rapidly depreciating USD following the global recession spurred Israeli Shekel strength until 2011, when aggressive stimulus efforts were offset by Euro-zone crisis issues.
Advertisement
Real Time News

Apr 19, 2024
Follow
Indices Update: As of 20:00, these are your best and worst performers based on the London trading schedule:
Wall Street: 0.57%
FTSE 100: 0.40%
France 40: -0.05%
Germany 40: -0.14%
US 500: -0.88%
View the performance of all markets via https://t.co/2NUaqnUPED https://t.co/4cMvZA7qyz

Apr 19, 2024
Follow
Commodities Update: As of 18:00, these are your best and worst performers based on the London trading schedule:
Silver: 1.79%
Gold: 0.68%
Oil - US Crude: 0.01%
View the performance of all markets via https://t.co/WHTs8622rG https://t.co/W0ogEyHpgm

Apr 19, 2024
Follow
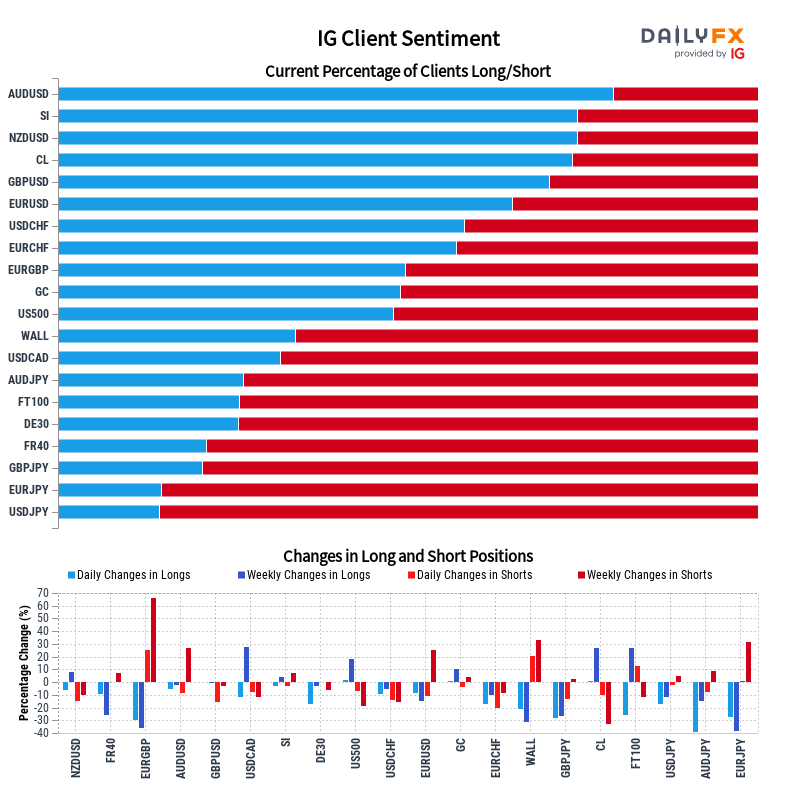
IG Client Sentiment Update: Our data shows the vast majority of traders in AUD/USD are long at 79.33%, while traders in USD/JPY are at opposite extremes with 85.61%.
See the summary chart below and full details and charts on DailyFX: https://t.co/QeYdESR2tp https://t.co/5TS2WfC3QC


Advertisement