


Forex Talking Points:
- If you’re looking to improve your trading approach, our Traits of Successful Traders research could help. This is based on research derived from actual results from real traders, and this is available to any trader completely free-of-charge.
- If you’re looking for a primer on the FX market, we can help. To get a ground-up explanation behind the Forex market, please click here to access our New to FX Trading Guide.
If you’d like to sign up for our webinars, we host an event on Tuesday and Thursday, each of which can be accessed from the below links:
Tuesday: Tuesday, 1PM ET
Thursday: Thursday 1PM ET
Do you want to see how retail traders are currently trading the US Dollar? Check out our IG Client Sentiment Indicator.
Gold Price Breaches Trend-Line, Exposes 2019 Low
Risk aversion themes have been on display of recent in Gold prices. A couple of weeks ago, I had looked at topside potential on a continuation of risk aversion, as echoed by similar themes of US equities pulling back. Gold caught a strong bid early last week and prices posed a quick run-up to resistance at 1302.76. But, that’s when the music stopped, and since then, bears have been pushing back as risk tolerance has extended. Gold prices put in a breach of a bullish trend-line that had previously helped to catch the May low. This runs around a double-bottom at 1266.10. A break-below that level exposes a deeper pocket of support around the 1252-1253 area on the chart.
Gold Price Four-Hour Chart

Chart prepared by James Stanley
US Oil Builds Range Between Fibonacci Levels
Recent Support in WTI has shown around 62.85 while resistance has continued to play-in from around 63.71. This has produced a range-bound environment over the past week. A bullish break above 63.71 could soon re-open the door to topside strategies, looking for targets towards the 64.50-64.77 level on the chart.
US Oil Two-Hour Price Chart
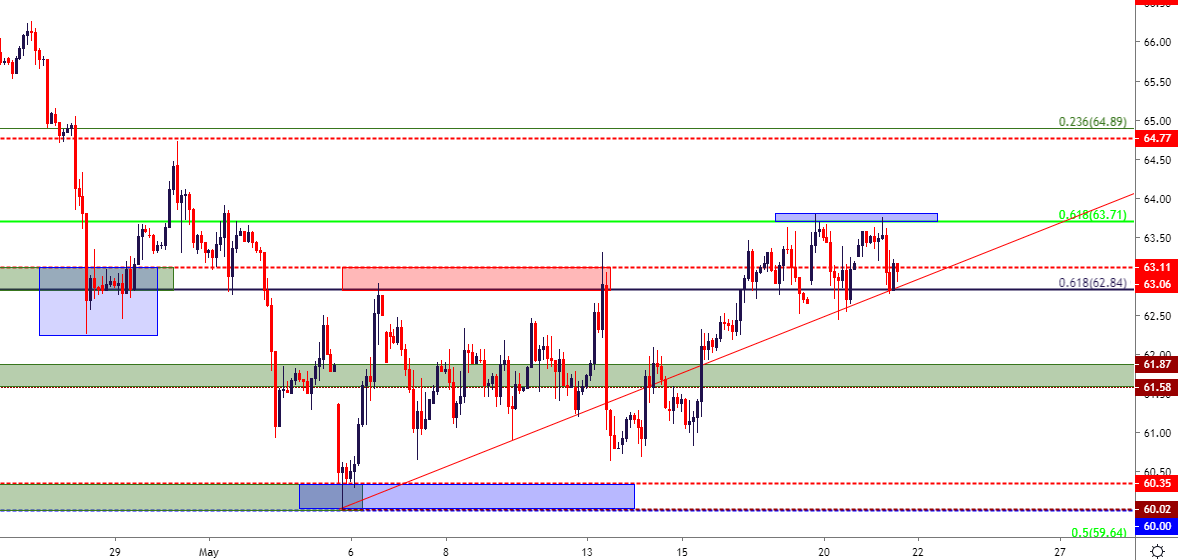
Chart prepared by James Stanley
EUR/USD Trap Potential – European Elections Coming Up
EUR/USD has been fairly quiet so far this week, all factors considered. But, that may not last for long as this Thursday brings the start of European elections and that runs alongside the release of ECB minutes for Thursday morning. Notably – EUR/USD appears as a bear trap given the current backdrop. Despite last week’s consistent run of USD-strength, EUR/USD bears have been fairly shy around tests of prior lows. This morning even brought a quick flicker of strength in the pair, but sellers showed up around the 1.1187 Fibonacci level that marks the bottom of the prior support zone. This can make for a muddy backdrop going into the later-week risk items in the pair.
For more background on European elections and how that might impact the single currency, our own Martin Essex has produced a primer for the event entitled, Euro Price Slide Set to Continue as European Elections Draw Closer.
EUR/USD Four-Hour Price Chart

Chart prepared by James Stanley
GBP/USD Holding a Big Area of Long-Term Support
Brexit dynamics have made an appearance in GBP/USD, once again. And this can be a difficult theme to work with as it’s a rather pensive manner with a low degree of predictability. But – for volatility traders, this may produce a workable backdrop. At this point, GBP/USD is testing a big area of support that I’ve been following that runs from 1.2671-1.2721. This can keep the door open for reversal potential; and on the short-side of the pair, traders can look for breaks below 2671 to re-open the door for bearish strategies.
GBP/USD Daily Price Chart

Chart prepared by James Stanley
USD/CAD Ranges Between Key Support and Resistance
The 1.3500 level has continued to hold the highs in USD/CAD, and support has similarly played-in from a familiar zone of recent relevance. The approach here may be more attractive on the long side, looking for the recent higher-lows that have started to price-in to, eventually, bring upon a break of the resistance zone around 1.3500. In the webinar, I showed how a box breakout strategy could be instituted in the pair, along with how continued range could be worked with (in the Q&A portion of the session).
USD/CAD Four-Hour Price Chart
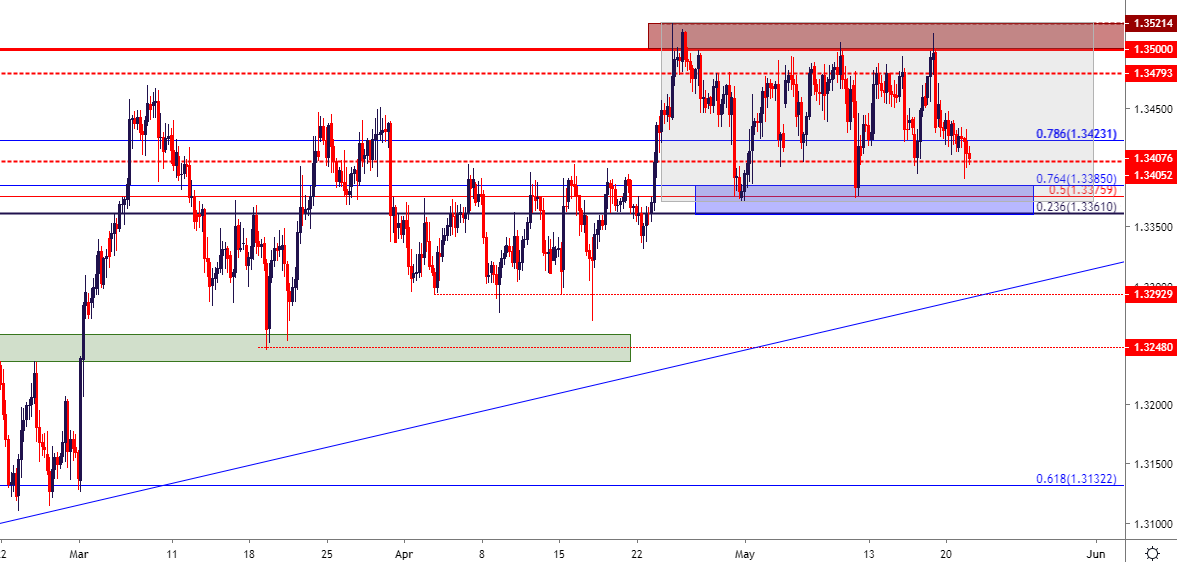
Chart prepared by James Stanley
USD/JPY – Beware the Gap Trap
There is a fairly attractive area of resistance potential nearing in USD/JPY, and this runs around a prior area of support from 110.75-110.86. This zone had most recently helped to set lower-high resistance following the early-May gap-down. To date, that gap hasn’t yet been filled, and this can make for a difficult backdrop. Prices moving back into 110.75-110.86 may give the attractive appearance of short-side potential; but traders may want to wait for that gap to first fill before entertaining such scenarios.
USD/JPY Four-Hour Price Chart
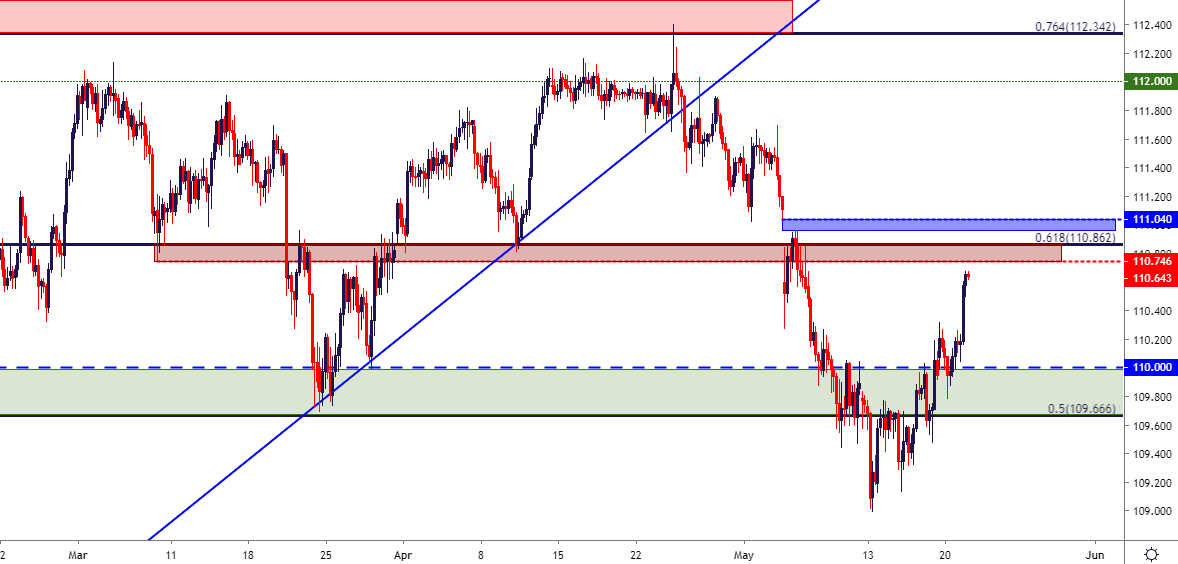
Chart prepared by James Stanley
Aussie Fills Gap, Clings to Support
I had looked into AUD/USD yesterday. The pair put in a gap-higher to open this week’s trade but, as warned yesterday, a fill of that gap coupled with a hold of last week’s low may soon open the door to bullish reversal strategies. That backdrop has since filled-in, and similar to GBP/USD above, this can open the door for topside strategies as long as that support holds and, if sellers are able to break-below, bearish strategies could come back into play to target the .6750 area on the charts.
AUD/USD Two-Hour Price Chart

Chart prepared by James Stanley
NZD/USD Clings to .6500
Similar as the above in AUD/USD with the notable exception of a better support structure around current levels.
NZD/USD Daily Price Chart

Chart prepared by James Stanley
To read more:
Are you looking for longer-term analysis on the U.S. Dollar? Our DailyFX Forecasts for Q4 have a section for each major currency, and we also offer a plethora of resources on USD-pairs such as EUR/USD, GBP/USD, USD/JPY, AUD/USD. Traders can also stay up with near-term positioning via our IG Client Sentiment Indicator.
Forex Trading Resources
DailyFX offers an abundance of tools, indicators and resources to help traders. For those looking for trading ideas, our IG Client Sentiment shows the positioning of retail traders with actual live trades and positions. Our trading guides bring our DailyFX Quarterly Forecasts and our Top Trading Opportunities; and our real-time news feed has intra-day interactions from the DailyFX team. And if you’re looking for real-time analysis, our DailyFX Webinars offer numerous sessions each week in which you can see how and why we’re looking at what we’re looking at.
If you’re looking for educational information, our New to FX guide is there to help new(er) traders while our Traits of Successful Traders research is built to help sharpen the skill set by focusing on risk and trade management.
--- Written by James Stanley, Strategist for DailyFX.com
Contact and follow James on Twitter: @JStanleyFX


