


Nasdaq, Dow, Dollar, GBPUSD and USDCAD Talking Points:
- The US open this past session carried forward the aggressive risk aversion that ended the previous day, but the window on the Nasdaq’s large gap was closed
- Top event risk for Wednesday is billed to be the US CPI figure as the markets dig into inflation and rate concerns
- While US indices and other risk assets are tethered to yield speculation, the Dollar is a prime target for volatility amid recent quiet
Volatility Carries Over for Risk Assets…And Trader Seek Out the Source
The nasty tumble that markets fell into through the closing hours of the US session Monday cascaded into he next trading day. With global equities market tracking the sentiment wave as it passed from session to session, it seemed that the risk of a full-blown ‘risk aversion’ shift was at hand. Looking across the landscape, the genuine erosion of confidence was apparent in nearly all the asset classes I monitor as well as across all time zones – my preferred measure of conviction rather than any single barometer. Naturally, market participants demand explanation; because a simple collective flight from an overleveraged environment does not reassure as it cannot be readily tracked and there isn’t a straightforward counterbalance. That is where the ‘inflation’ focus seemed to come in. A frequent headline these past weeks between the Fed statement, Yellen remarks, financial stability report, market commentators and data; it connects to deeper fears of dependency on stimulus. With the US consumer price index (CPI) on tap later today, we will see how focused the markets actually are on this wonkish theme.

Chart of Nasdaq 100 Index with 50 and 200-Day Moving Averages and Size of Gaps (Daily)
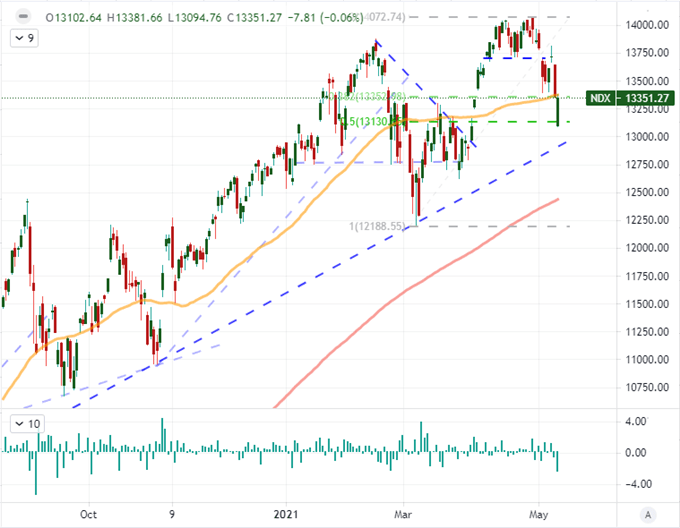
Chart Created on Tradingview Platform
Whether or not the ‘market’s favorite inflation indicator’ lives up to the hype or not, there is no mistaking the activity in the market. That is worth recognizing outside of the context of the narrative – as pure technicians often say ‘price matters most’. To follow on to Monday’s troubled performance, the Nasdaq 100 continued to lead the tumble Tuesday morning with the biggest bearish gap on the open (-1.9 percent) since October 2nd. That cleared short-term support for the index around 13,350. And yet, the day would end with the market little changed from the previous day’s close. The other major US indices I follow most often didn’t register as complete a recovery, but there was some sense of moderation. That balance often occurs before major event risk, which gives some credence to the believe that inflation data is carrying serious weight. On the other hand, I will also suggest we also hold open the possibility that this was simple a by-product of the ‘buy the dip mentality’ that has prevailed for so long. With that said, the Nasdaq’s slide relative to the benchmark ‘value’ index, the Dow, is still leaning precariously over the cliff and the VIX at 21.8 has settled at its highest since March 11.
Chart of Nasdaq 100 to Dow Index Ratio (Weekly)
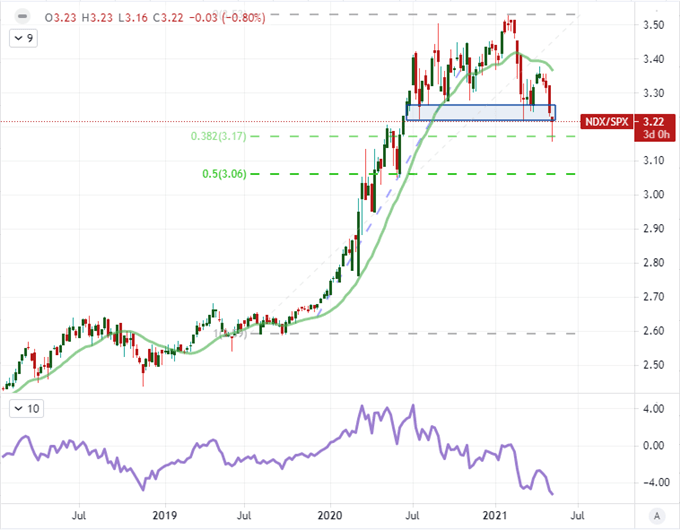
Chart Created on Tradingview Platform
Why the Inflation Data Matters
Over the past weeks, we have seen concern around inflation pressures build to significant levels. Measures like the five-year breakeven rate have become common discussion points in trading circles as it has pushed to highs not seen since 2006. At its April 28th monetary policy meeting, the Federal Reserve tried to calm fears that price pressures would continue to build and they be forced to tighten their exceptional monetary policy regime – which the markets have grown acutely dependent upon for a sentiment safety net. This attempt to fight back the encroaching gloom is why there was such an outcry over Treasury Secretary Janet Yellen’s remarks that rates may need to rise to prevent an overheated economy. She walked the sentiment back (or ‘clarified’), but we are left with a market that is far more aware of inflation nonetheless. Google search for the term in the US has hit record highs – at least as far back as data has been collected since 2004.
Chart of Search Ranking for ‘Inflation’ via Google Trends (Daily)
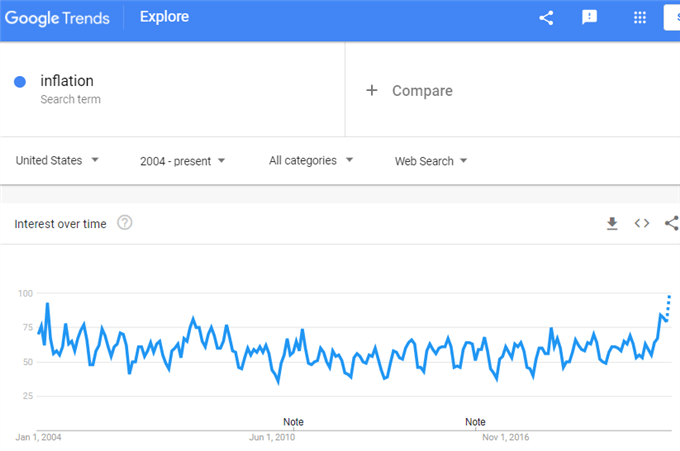
Chart Created on Google Trends
While there is much fanfare around the importance and timeliness of the Bureau of Labor Statistics consumer inflation data, there have been a number of indicators that have already clued us in to serious inflation pressures – from record high commodity prices on exchanges to the central bank’s own favorite PCE deflator report. Nevertheless, if the market is emphasizing this data as a critical catalyst for sentiment, we should observe its impact closely. The economist consensus projects a sharp one percentage point increase in the headline figure from a 2.6 to 3.6 percent annual pace. The Fed’s inflation target is 2.0 percent, but they have stated repeatedly that they believe the swell is transitory and that they will allow for a period of above-target readings. That doesn’t mean, however, the market will believe their intent or forecasting.
Chart of US Headline CPI, Core CPI and PPI (Monthly)
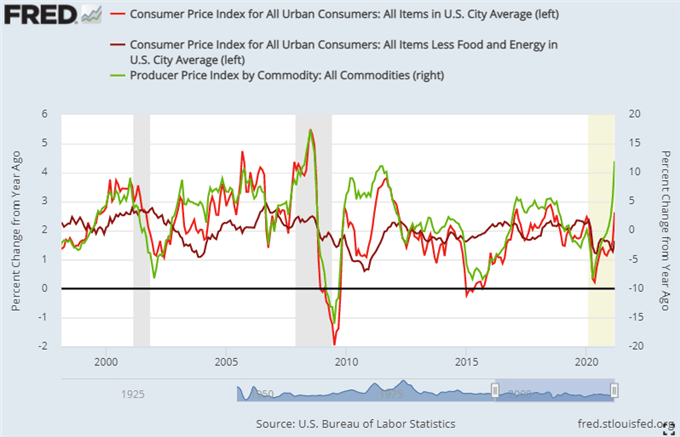
Chart Created on St. Louis Fed Economic Database with Data from the BLS
More Than the Nasdaq and Risk Assets, Where to Watch for a Fundamental Impact
While the more distinct risk assets have shown considerable volatility this past 48 hours, I believe it may still be a high bar to elicit activity at this same level moving forward even with inflation. There are many example of key data simply incapable of unseating the market’s vacant speculative gaze (eg FOMC, GDP, NFPs). If the focus is truly on the inflation such that it can alter the undercurrent, I believe there will be a strong reaction from the US Dollar. The greenback has struggled for the past six weeks in a significant slide that has was pushed along by the Fed’s rebuke of normalizing policy and the jobs report miss. If inflation is seen as posing a problem moving forward, risk aversion may or may not override its indecision; but the US currency is very likely to respond. A higher inflation response would likely see the Dollar rally for a boosted rate forecast and/or through catering to its safe haven appeal. If pressures are interpreted as being tame, the DXY’s 90 support could give and then support gets serious around 89.25.
Chart of the DXY Dollar Index with 20 and 100-Period Moving Averages (4 Hour)
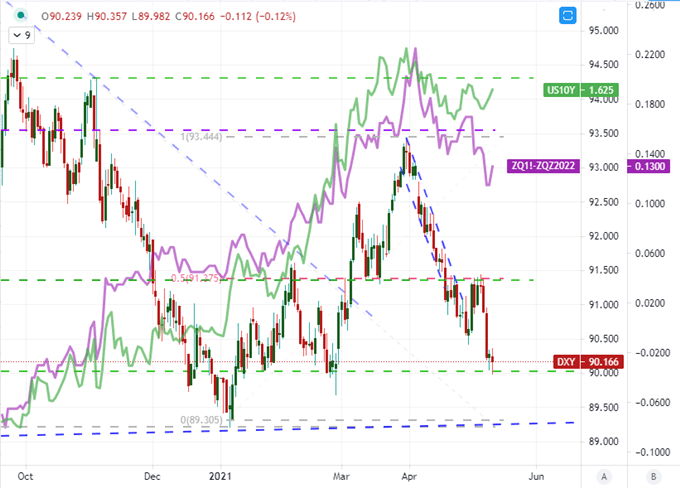
Chart Created on Tradingview Platform
While the Dollar itself is at the top of my radar, picking the pairs to monitor most closely is not particularly easy. Pairs like EURUSD and USDJPY are not within ready reach of critical technical barriers which will complicate the confluence of chart influences and event risk to leverage the biggest absolute response. GBPUSD is an interesting pair in this regard as there is meaningful technical weight in the zone of resistance from 1.4200 to 1.4300 and recently cleared 1.4000 is near term support. Helping the volatility case along, is the Sterling’s own activity. Aside from its recent rally after re-opening headlines, we have a run of data from London today anchored by March and 1Q GDP.
Chart of GBPUSD with 100 and 200-Day Moving Averages (Daily)
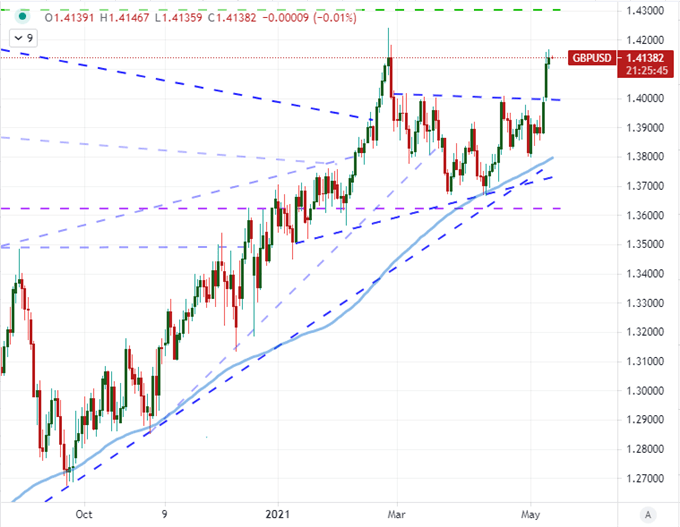
Chart Created on Tradingview Platform
Another pair I think worth watching is USDCAD. Unlike the Cable, there isn’t a run of high-level competing event risk from Canada. That may work in the pair’s favor for gaining traction though as there won’t be a prioritization with anticipation overriding response to an earlier report nor the scenario of offsetting releases. That said, USDCAD has dropped for months and its most recent few weeks’ accelerated slide puts it in a better position to snap back should the opportunity arise.
| Change in | Longs | Shorts | OI |
| Daily | 0% | -9% | -6% |
| Weekly | 48% | -10% | 3% |
Chart of USDCAD with 100-Day Moving Average (Daily)
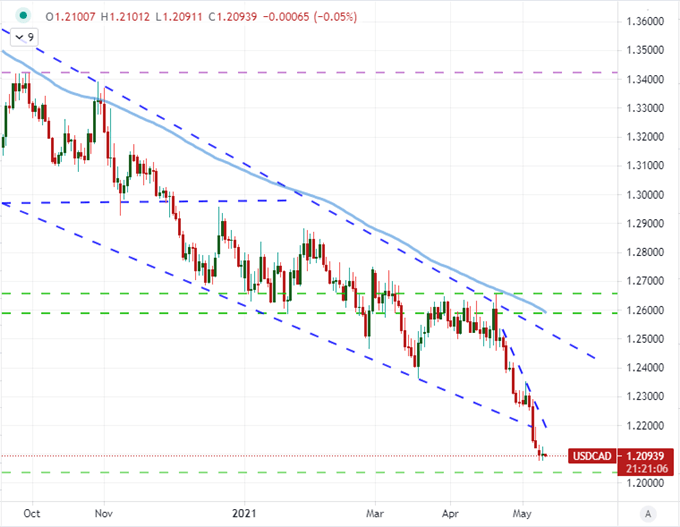
Chart Created on Tradingview Platform

.


