


GOLD PRICE FORECAST: GOLD RETREATS DESPITE STOCK MARKET SELLOFF, SPIKE IN VOLATILITY & PLUNGE IN YIELDS AMID GROWING CORONAVIRUS CONCERNS
- Gold prices pull back from a seven-year high as the precious metal recharges before another potential move higher amid spiking volatility and plunging yields
- Spot gold (XAU/USD) finds initial technical support around a key Fibonacci retracement level as concerns over the novel coronavirus outbreak continue to fester
- Check out this Gold Forecast: Bullion Bid on Recession Risk, Inverted Yield Curve for detailed insight on fundamental drivers likely steering gold prices up
Gold has recorded a parabolic climb over the last several months and has pushed the precious metal to seven-year highs. Gold performance has not only glistened, but also outshines other asset classes like the US stock market.
| Change in | Longs | Shorts | OI |
| Daily | -2% | 10% | 4% |
| Weekly | 8% | -7% | -1% |
For example, the 30% surge in spot gold prices compares to a much-less impressive 15% rally in the S&P 500 Index since the May 2019 lows printed by the commodity and equity benchmark.
CHART OF GOLD PRICE PERFORMANCE RELATIVE TO S&P 500 INDEX
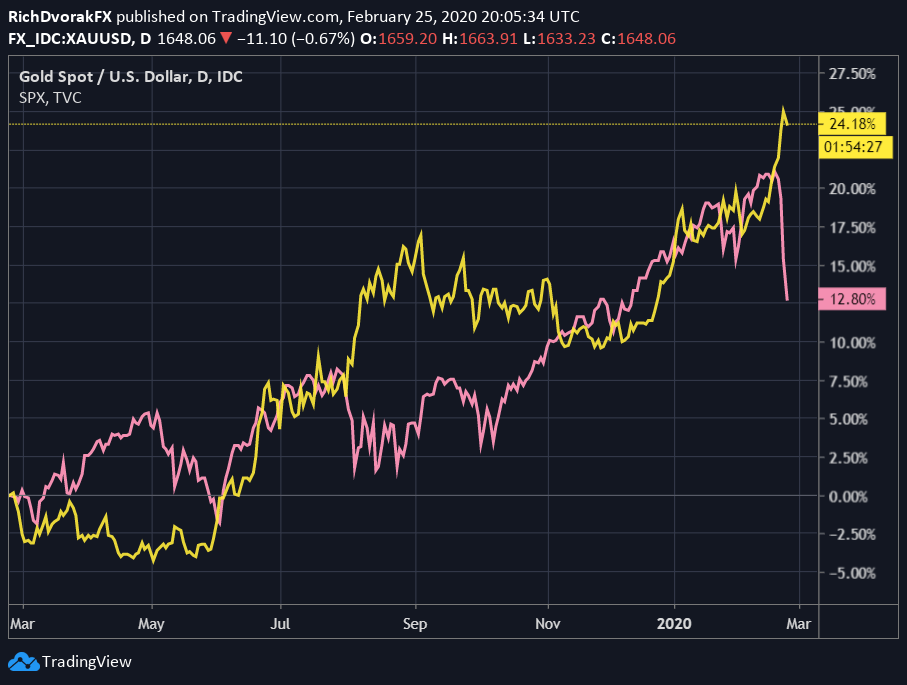
Chart created by @RichDvorakFX with TradingView
Relative performance between stocks and gold so far this year is also quite notable. The S&P 500 Index is in the red by 3% while gold is up by 8% year-to-date.
The novel coronavirus outbreak in Wuhan, China earlier this year has rekindled recession odds and plagued market sentiment. This development largely explains the anti-risk move out of stocks and into safe-haven assets like gold.
CHART OF SPOT GOLD (XAU/USD), VOLATILITY (VIX) & TEN-YEAR TREASURY YIELD (US10Y, INVERTED)
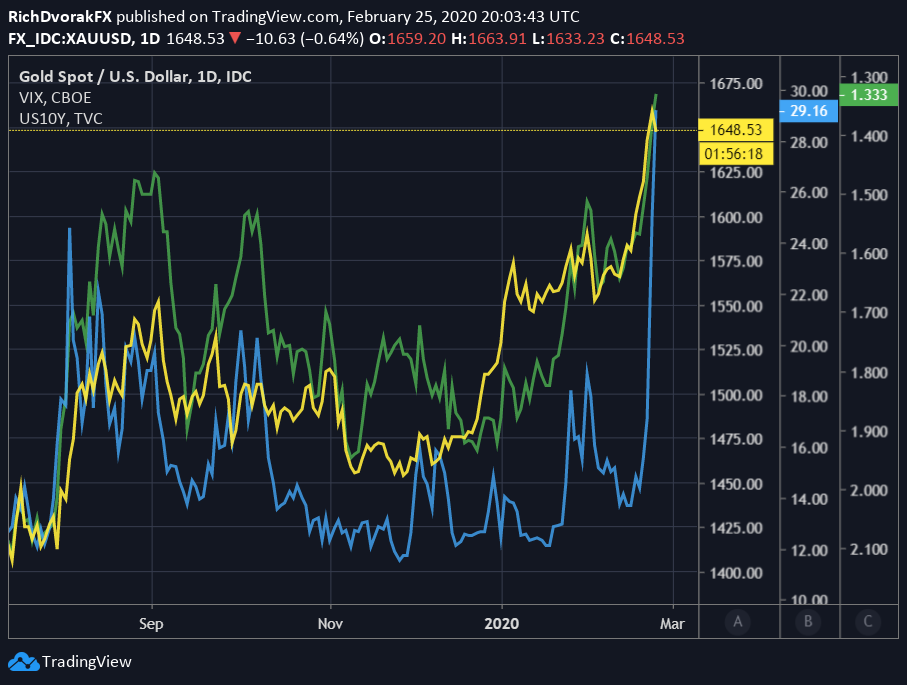
Chart created by @RichDvorakFX with TradingView
Spot gold price action looks like it is taking a breather now considering the precious metal is lower on the day by about 0.5%. Catalysts for today’s modest dip are limited when taking the theme of widespread risk-aversion into account, which typically bolsters bullion.
The small pullback in spot gold prices today also seems peculiar in light of the spike in volatility and US Treasuries. There is generally a strong positive correlation between the price of gold, US Treasuries and volatility.
GOLD PRICE CHART TECHNICAL OUTLOOK
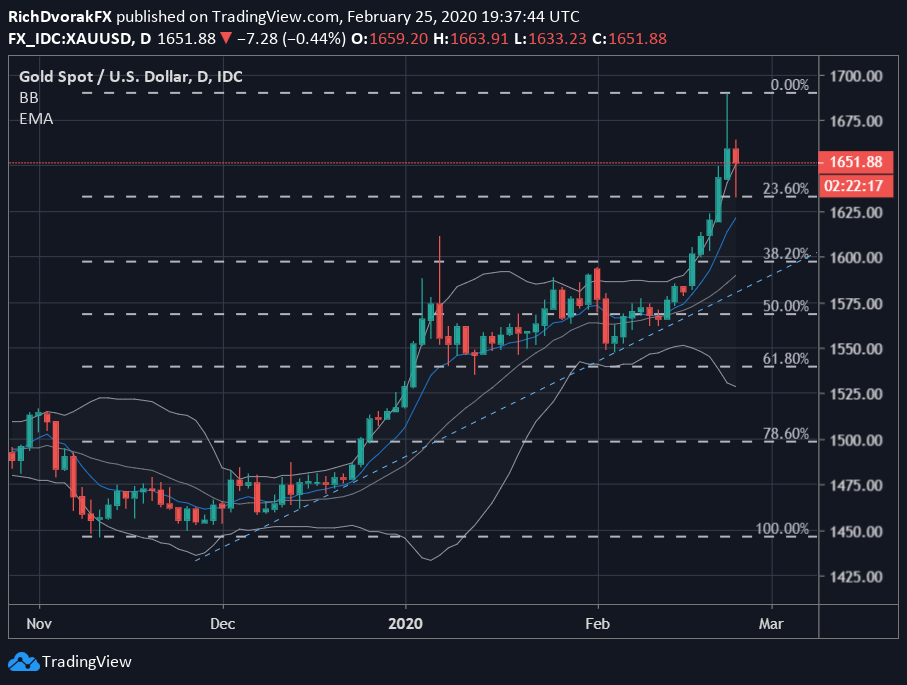
Chart created by @RichDvorakFX with TradingView
That said, the latest bit of downside in gold might be driven by healthy profit-taking and unwinding of long positions after the precious metal skyrocketed to its highest since January 2013 yesterday.
Gold prices appear to have found initial technical support around the $1,635 level and 23.6% Fibonacci retracement of the commodity’s most recent bullish leg. This area may have potential to keep bullion buoyed going forward before a retest of the $1,600 price level might be considered.

If near-side technical resistance can be topped around $1,660 however, gold prices might look poised to continue pressing higher toward the $1,700 handle before 2012 highs come into focus.
Learn More: Top Gold Trading Strategies & Tips
-- Written by Rich Dvorak, Junior Analyst for DailyFX.com
Connect with @RichDvorakFX on Twitter for real-time market insight


