


To receive Ilya's analysis directly via email, please SIGN UP HERE
Talking Points:
- USD/JPY Technical Strategy: Flat
- Support: 119.66, 118.93, 118.20
- Resistance: 120.68, 121.46, 122.13
The US Dollar may have resumed its uptrend against the Japanese Yen after completing a Flag chart pattern. A daily close above the 38.2% Fibonacci expansion at 120.68 exposes the 50% level at 121.41. Alternatively, a reversal below 119.66 (38.2% Fib retracement, channel top resistance-turned-support) opens the door for a challenge of the 50% retracement at 118.93.
While entering long seems compelling from a purely technical perspective, we will tactically opt to stand aside for now. The upcoming release of minutes from the March FOMC meeting represents significant event risk that may materially alter positioning.
Add these technical levels directly to your charts with our Support/Resistance Wizard app!
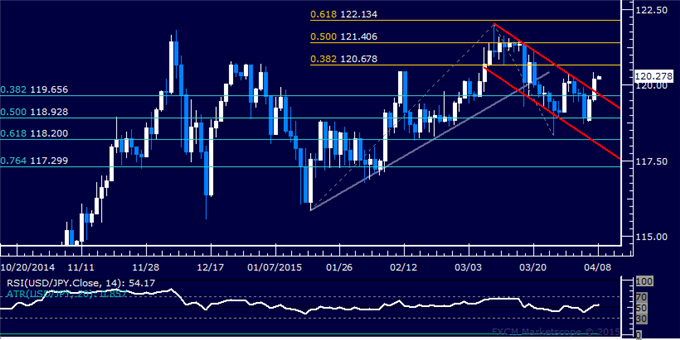
Daily Chart - Created Using FXCM Marketscope
--- Written by Ilya Spivak, Currency Strategist for DailyFX.com


