


To receive Ilya's analysis directly via email, please SIGN UP HERE
Talking Points:
- USD/CHF Technical Strategy: Flat
- Support:0.9538, 0.9462, 0.9367
- Resistance: 0.9614, 0.9709, 0.9767
The US Dollar continues to sink against the Swiss Franc, with prices registering their longest losing streak in 11 months. Near-term support is at 0.9538, the 50% Fibonacci expansion, with a break below that on a daily closing basis exposing the 0.9462-90 area (61.8% level, April 3 low). Alternatively, a turn above the 38.2% Fib at 0.9614 clears the way for a test of the 23.6% level at 0.9709.
Risk/reward considerations argue against entering short with prices in close proximity to support. On the other hand, the absence of a defined bullish reversal signal suggests taking up the long side is premature. We will remain flat for now, waiting for an actionable opportunity to present itself.
Add these technical levels directly to your charts with our Support/Resistance Wizard app!
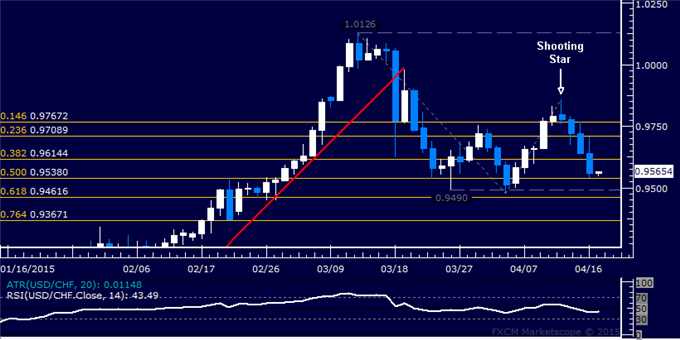
Daily Chart - Created Using FXCM Marketscope
--- Written by Ilya Spivak, Currency Strategist for DailyFX.com


