Talking Points:
--USD/CAD Technical Strategy: On Hold as Key Resistance Is Tested
-CAD Weakness Set to Meet a Key Test in September 29th Range
-Inversely Correlated Market WTI Crude Oil Similarly At Key Support
USDCAD and WTI Crude Oil appear set to print fresh Multi-Year extremes. USDCAD is looking to break above the September 29th highs, and Crude Oil is back near the lows of late August. The inverse correlation of USDCAD & WTI Crude Oil over the last month is a significant -0.52. Correlation Coefficients range between 1 and -1 where a 1 read means the markets are nearly handcuffed, and a -1 means that markets are inversely correlated to the point of near opposites. A reading of -0.52 helps us to see that if Crude continues to move lower, USDCAD will likely continue to move higher. Currently, the steep plunge in commodities seems to be setting the stage for multi-year lows in Oil and other commodities as Gold printed 5-yr lows today.
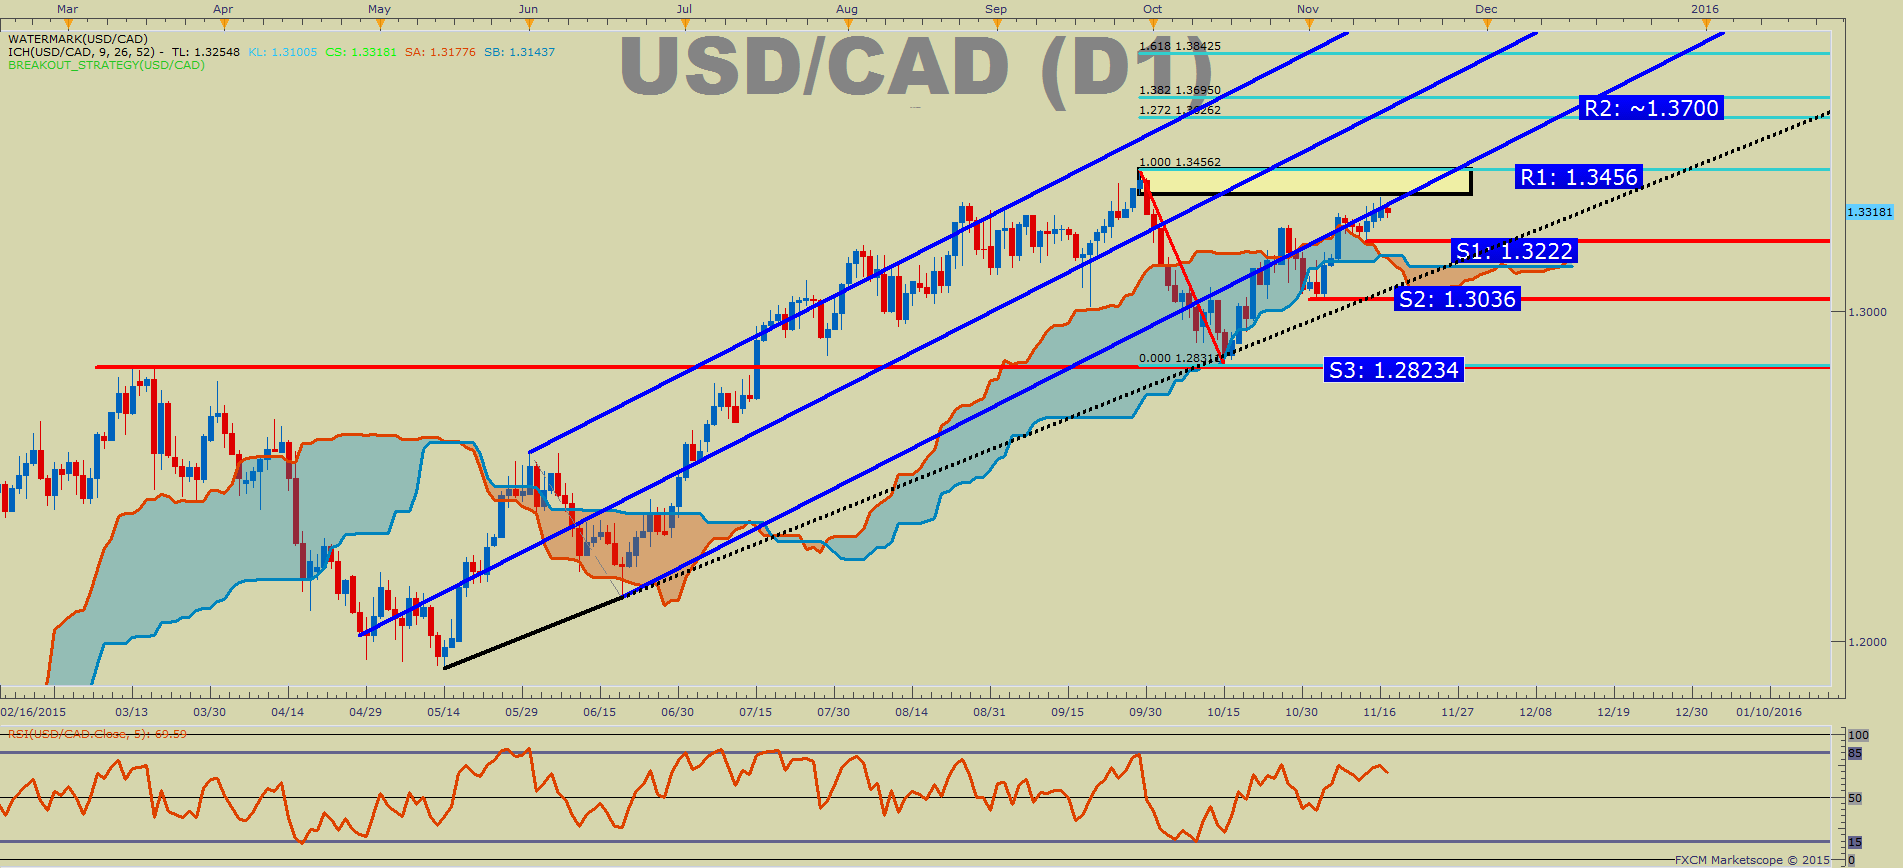
USDCAD has come into the YTD extreme day price range low and stalled. The September 29th price range on USDCAD is 1.3456 (the high) - 1.33708 (September 29th low). Earlier this week, we came into the low of September 29th at 1.3370 and had since retreated over 70 pips. Now, we’re looking to see if the prior higher-low support of 1.3222 can hold. An inability to hold above the higher-low 1.3222 could show us that a strong move off resistance is underway at a time that Sr. Currency Strategist Kristian Kerr has noted as very important.
Looking at the chart below, you can see a trendline off the May & June low as well as the Ichimoku cloud caught the current 600+-pip drop. Now, after bouncing higher, you can see we ran into clear resistance at the September 29th price range, which was also yesterday’s high. Now we have key support at 1.3222 & 1.3036 and, until you see a break below these levels, it’s still likely a risky sell because of the momentum. In other words, if we break below the 1.3222 & 1.3036, our focus can turn lower but until then, we may still have unfinished business higher. Should we get a break lower below 1.3222-1.3036, we can credibly open up the conversation that we might be working out a double top. The double-top view is not my preferred view if we stay above 1.3222 and continue to test and potentially break above the September 29th range. However, an extreme day price range reversal zones are a favorable spot to look for reversals when other signs are absent. To not mention that would be a disservice to you. Lastly, we are seeing higher volume on USDCAD on up days that is showing that investors are committed to the overall rising trend, so it’s more of a sit back and watch until the next key break surfaces.
Would You Like To Know the Traits of Successful FX Traders? If So, Click Here