To receive Tyler’s analysis directly via email, please SIGN UP HERE
Talking Points:
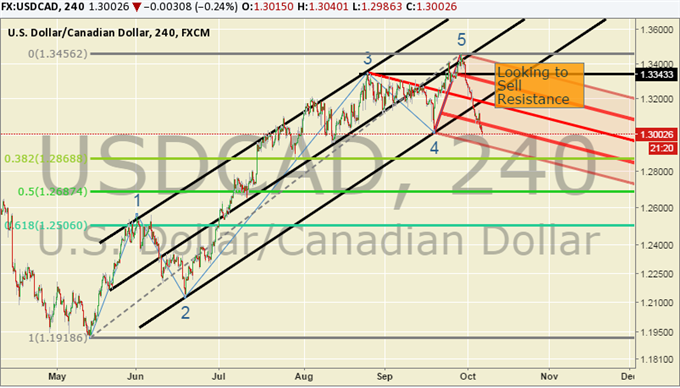
- USD/CAD Technical Strategy: Bearish Key Weekly Candle now Resistance
- 6-Day Bearish Extreme Favor Selling Bounces
- Oversold RSI Warns of Bounce Higher / Likely Better Levels to Sell
USDCAD is inversely correlated to USOil, which just broke through a key resistance of 49.49. Aligning with the theme of commodity currency strength after a disappointing Non-Farm Payroll in the United States on October 2.After we confirmed the Bearish key week by closing below 1.3175, we can now look to sell strength as this multiyear trend may be set for a deeper correction. Additionally, look for this week’s Canadian Employment report on Friday to further confirm whether we could have a favorable move for the CAD on our hands. Given the long-term strength of the trend, this could be a choppy move lower and will likely be fought but the topping signals shouldn't be ignored.
We have witnessed support erosion of the key trend structureat 1.3012 we are closing in on 1.2950. Now that a basing low of 1.3012, which preceded an 11-year high has broken, we can look to resistance for short exposure. The 1.2950 low came at multiple technical confluence points showing respect to the larger trend. Considering the follow through move off 1.2950 gave us 11-year highs it’s easy to see this as key support. As a reminder, we’re in the opening range of Q4 2015 where significant highs and lows for the quarter are often set. Therefore, it’s worthwhile to be patient to see if the large trend reverses or resumes. Median-line resistance is now around 1.3150 where a short-order entry would look attractive.
We had earlier noted some the work stating that dollar was showing signs of the top broke as we broke below the 55 day moving average for the first time since June. We are continuing to see reversal signals that could test the mid-20s if not lower. Next confirmation would be a break and close below 1.2950 that would open the door to start focusing on sharp breakdowns if aligned with a sustained breakout in USoil.SSI shows that long positions have now grown 61.2% over the last week while new short orders have collapsed, which may be an indication that this turn could be aggressive. Downside targets around 1.2868-1.2505.
Add these technical levels directly to your charts with our Support/Resistance Wizard app!