To receive Tyler’s analysis directly via email, please SIGN UP HERE
Talking Points:
-USD/CAD Technical Strategy: Favorable Risk: Reward To Establish Long
-Time Based Correction Means Sideway Chop Could Continue
-Long Bias Invalidated on Break and Daily Close below 1.3115 (Less than 100 pips)
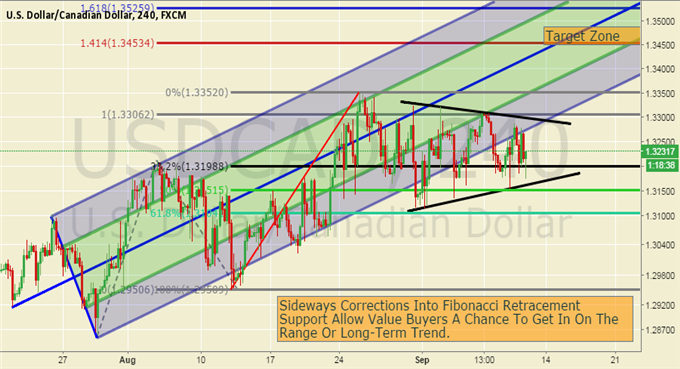
The Canadian Dollar has been unable to catch a bid as the highly correlated Oil market fails to break resistance both pushing USDCAD higher longer-term. As USDOLLAR momentum has also slowed after a recent surge, USDCAD has moved sideways and overlapped prior price action. However, the 34 day moving average around 1.3145, has held as support and a continuation of this support favors a push higher towards Fibonacci Expansion targets of 1.3453/1.3525.
USDCAD continues to trade within a large range of 1.3150, the Sept. 9th low to 1.3350, the Aug 25th low. A support zone of the Sept. 3rd low at 1.3137 through the Sept. 8th low at 1.3185 keeps the focus higher. A break below that zone alone would turn the focus lower and perhaps significantly so. The current high of 1.3350 falls nearly 100-200 pips short of a significant resistance zone (1.34/36) although it’s worth noting we could be forming a rising wedge that would take us higher towards 1.3600.
Below the 34-day moving average at 1.3145, trend structure support is currently at 1.2950. The 5-day ATR of 107 pips provides a decent amount of volatility to trade the range until a breakout appears. Currently, Fibonacci retracement support continues to allow short-term value buyers a zone to take a percentage of the ATR from USDCAD.
Add these technical levels directly to your charts with our Support/Resistance Wizard app!