


To receive Ilya's analysis directly via email, please SIGN UP HERE
Talking Points:
- USD/CAD Technical Strategy: Flat
- Support: 1.2271, 1.2137, 1.2055
- Resistance: 1.2379, 1.2487, 1.2621
The US Dollar resumed its advance against its Canadian namesake, rising to the highest level in six weeks. Near-term resistance is at 1.2379, the 50% Fibonacci retracement, with a break above that on a daily closing basis exposing the 61.8% level at 1.2487. Alternatively, a turn below the 38.2% Fib at 1.2271 clears the way for a test of the 23.6% retracement at 1.2137.
Prices are wedged too closely between near-term support and resistance levels to justify taking a trade on a long or short side from a risk/reward perspective. With that in mind, we will continue to stand aside until a more attractive opportunity presents itself.
Add these technical levels directly to your charts with our Support/Resistance Wizard app!
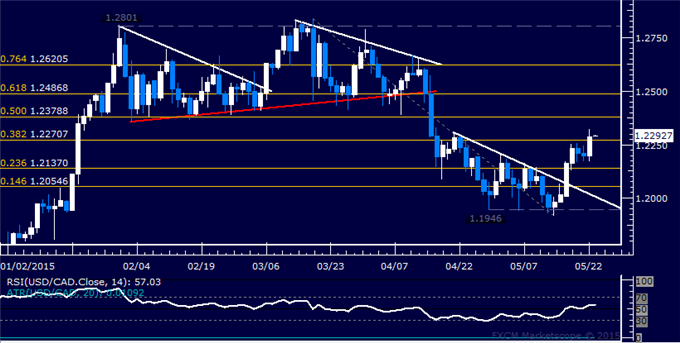
Daily Chart - Created Using FXCM Marketscope
--- Written by Ilya Spivak, Currency Strategist for DailyFX.com


