


To receive Ilya's analysis directly via email, please SIGN UP HERE
Talking Points:
- USD/CAD Technical Strategy: Flat
- Support: 1.1801, 1.1744, 1.1673
- Resistance: 1.1858, 1.1928, 1.2042
The US Dollar may be preparing to turn lower against its Canadian namesake after prices put in a Shooting Star candlestick. Near-term resistance is at 1.1858, the 61.8% Fibonacci expansion, with a break above that on a daily closing basis exposing the 76.4% level at 1.1928. Alternatively, a turn below the 50% Fib at 1.1801 clears the way for a test of the 38.2% expansion at 1.1744.
Prices are too close to support to justify entering short from a risk/reward perspective. On the other hand, the absence of a defined bullish reversal signal suggests that taking up the long side is premature. With that in mind, we will remain flat for now.
Add these technical levels directly to your charts with our Support/Resistance Wizard app!
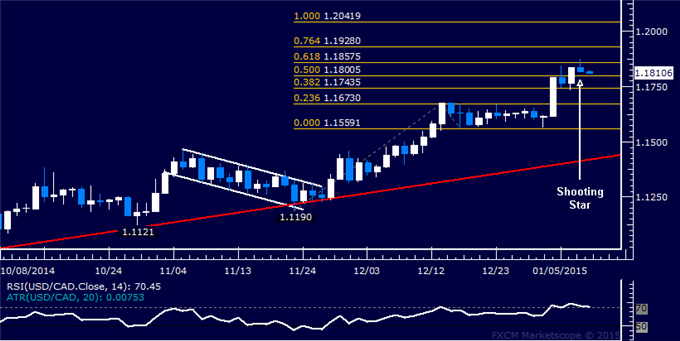
Daily Chart - Created Using FXCM Marketscope
--- Written by Ilya Spivak, Currency Strategist for DailyFX.com


