


To receive Tyler’s analysis directly via email, please SIGN UP HERE
Talking Points:
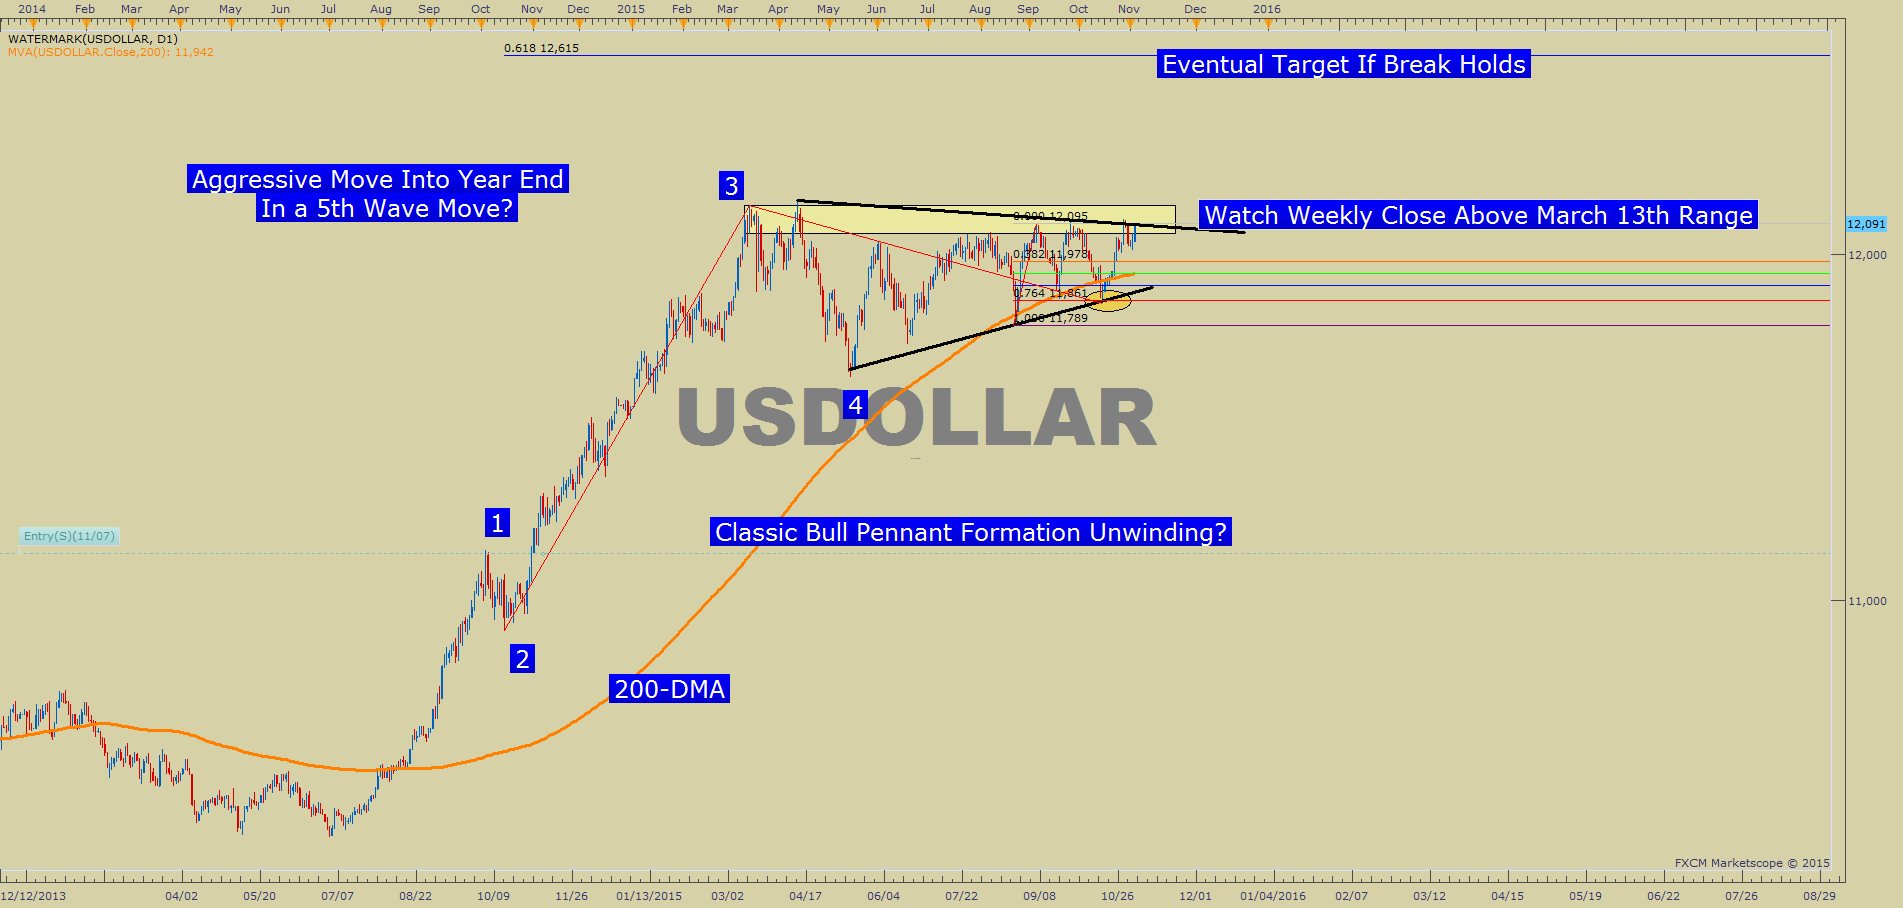
-US Dollar Technical Strategy: US Dollar Moves Aggressively Into Chart Resistance
- Third Failure At 200-DMA May Prove of US Dollar's Resilience
-US Dollar Faces Key Test On Weekly Close
The US Dollar has benefited from increasing bets that the Federal Reserve will raise interest rates as soon as December. This view has been bolstered by recent economic data prints as well as testimony given by Janet Yellen to Congress on Wednesday. At the close of London Markets, The US Dollar was stronger than all G10 counterparts, and where seen a credible push into key resistance such that this move may be the one that takes us to the other side and validates the initial stages of the larger run higher.
Resistance near the closing highs of both March 13 and April 13 at 12,130 will prove formidable resistance. However, a weekly close that will be largely influenced by nonfarm payroll for the month of September above 12,130 would likely scare any dollar shorts out of their position. Support currently sits at the November opening range low of 12,013 and followed by the October low of 11,852. Should the support levels hold, the most credible technical analysis chart pattern appears to be the bullish pennant, a trend continuation pattern that derives its name from the commemorative flag.
A common time pattern in markets is for a trend to correct for a similar length of the prior impulse lasted. The move higher from July 2014 to the noted topping process that began in March 2015 lasted eight months. We are currently now eight months away from the March peak so a continuation higher now would be appropriate from a time competent. The blast higher from 12,013 may just be underway and not until that level is penetrated will the view of US Dollar biased higher change. Additionally, the 200-DMA has proven as strong support and the third failure to push below the major moving average could slingshot USD higher. T.Y.
We hope you enjoyed this short-term US Dollar Outlook, be sure to sign up for our free Dollar Guide here. (Click chart for larger image)
--- Written by Tyler Yell CMT,Currency Analyst
Contact and follow Tyler on Twitter: @ForexYell


